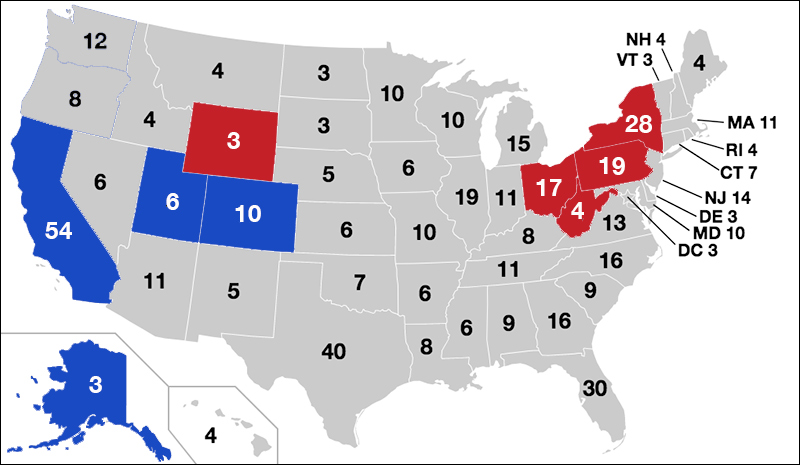
Electoral College Votes Per State, 2022 — blue moving more left, red moving more right
By Jim Ellis — Tuesday, Dec. 20, 2022
President
Electoral College: West Moving Left, East Moving Right — The researchers at the University of Virginia’s Center for Politics have completed a study regarding the country’s ideological shift during the past 20-plus years. Tracking all 50 states’ presidential votes from the 2000-2020 elections, we first see all of the western states now voting Democratic in greater percentages with the exception of Wyoming. The biggest shifts came in Alaska, California, Colorado, and Utah, though two of those four states still regularly produce at least smaller majority or plurality Republican victories.
Conversely, the south and east have trended more Republican with the strongest swings generally occurring in central south with only Maryland, Rhode Island, Vermont, and Virginia becoming more Democratic. Mid-Atlantic states such as New York, Ohio, Pennsylvania, and West Virginia have moved decidedly more Republican, though two of these four continue to regularly deliver clear Democratic majorities. Remaining constant in their voting pattern during this entire 20-year span are Illinois, Maine, Massachusetts, Minnesota, and South Carolina.
House
VA-4: Republicans Choose Special Election Nominee — Republicans re-nominated their 2020 and 2022 candidate in the Saturday, Dec. 17 “firehouse primary” through Ranked Choice Voting. The local 4th District Republican Party leadership did not release the actual results, only to say that pastor and US Navy veteran Leon Benjamin had defeated former Mecklenburg School Board member Dale Sturdifen, and non-profit advocacy organization director Derrick Hollie. Benjamin now advances to the Feb. 21 special general election to replace the late Rep. Donald McEachin (D-Richmond). He will again be a decided underdog in a district that the FiveThirtyEight data organization rates D+30.
The Democratic firehouse primary will be held today. Four candidates filed to run: state Sens. Jennifer McClellan (D-Richmond) and Joseph Morrisey (D-Richmond), former state Delegate Joseph Preston, and businessman Tavorise Marks. While the special election will be held in late February, Gov. Glenn Younkin’s (R) call required the parties to choose nominees by Dec. 23.
In another development, Colette McEachin, the late congressman’s widow, announced her endorsement of Sen. McClellan, joining most of the Virginia Democratic establishment who has already done so.
States
North Carolina: NC Supreme Court Tosses State Senate Map — The North Carolina state Supreme Court, with the 4-3 Democratic majority on the cusp of expiring, rejected the NC Senate map on a partisan vote as a partisan gerrymander. But, the action is likely to be short-lived and adds fuel to the speculation that the new legislature will re-draw all of the state’s redistricting maps after commencement. Doing so may well render moot the partisan gerrymandering case that the US Supreme Court recently heard.
Under North Carolina legislative procedure, the governor has no veto power over redistricting legislation, so whatever the legislature passes will become law. Because of the current court’s farewell action, the state Senate map must be re-configured. Since Republicans gained two seats on the state Supreme Court in the November election and will have a 5-2 majority beginning in January, the likelihood of not only the Senate map being redrawn but also the state House and congressional delegation plans is greater. The latter two maps are court-drawn interim placeholders, which the legislature can replace at any time.