Tag Archives: Pew Research Center

An Adjustment in Attitudes

Pew Research Center
(Click on link or on image above to go to Pew Research Center.)

By Jim Ellis

Sept. 1, 2021 — Largely due to a major shift in perception among Republicans, some American institutions have suffered a major image decline. In July, the Pew Research Center conducted another survey of views and attitudes regarding the country’s key institutions and compared it with a similar study they conducted two years ago.

(The Pew Research report is available at this link: Republicans increasingly critical of several major U.S. institutions, including big corporations and banks)

As has been the case for the past few years, the people identifying with each of the two major political parties see things from an opposite perspective. For most institutions, the aggregate party respondents have become even more polarized in their views. In three particular instances the institutional favorability index changed rather significantly during the relatively short two-year interval between the Pew studies.

Expressing some optimism, the response to whether churches and religious organizations have a “positive or negative effect on the way things are going in the country,” actually received improved ratings.

Among both Republicans and Democrats, the religious-affiliated entities ascended. Now, 62 percent of the respondents believe these God-centric groups have a positive effect upon the country, up a net four points from the July 2019 survey. Republicans remained constant through the two surveys at a very high 76 percent approval rate. Democrats jumped from just 44 percent expressing a positive sentiment in 2019 to 52 percent this year.

For a pair of institutions, however, the normally disparate views surprisingly strike an equivalent balance. Concerning financial institutions and large corporations, the responses between the Republican and Democratic respondents were nearly identical.
Continue reading

Pew’s Post-Election Findings

By Jim Ellis

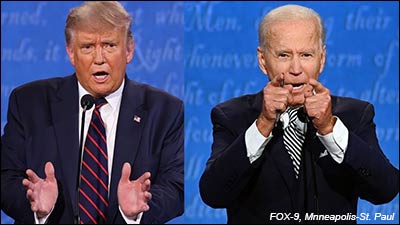
The candidates in action at the first presidential debate in Cleveland, Ohio: President Donald Trump (left) and former vice president Joe Biden.

July 8, 2021 — The Pew Research Center conducted a post-election poll and spent seven months developing their conclusions. On the last day of June, they publicized their report.

The study, conducted just after the November election (Nov. 7-12; 11,818 individuals through groups of screened panelists, online) was exhaustive.

Quoting the methodology description, “noncitizens and those who refused the citizenship question (N=450), voters who refused to answer the vote choice question (N=84) and panelists who declined to provide their names and thus could not be matched to a voter record (N=139) were removed, leaving 11,145 panelists for analysis.” Of this latter number, 9,668 respondents were validated as voters, meaning the research team verified with a local election office that the particular individual had in fact voted.

The basic voter segmentation conclusions were speculated upon in most media sectors during the early post-election period, but this research validates and expands upon the discovered patterns. Largely, President Biden received a significant boost from suburban voters, which proved the major difference in his increasing Democratic popular vote performance.

Despite losing the popular vote by a substantial margin, former President Trump surprisingly improved his standing with several groups such as Hispanics, Asians, black men, young voters, and women, but not to the degree necessary to counter Biden’s strength with suburban voters.

For example, among suburban voters, according to the Pew research, Biden recorded 54 percent support as compared to Hillary Clinton’s 45 percent in the 2016 election. Conversely, Trump only carried white voters 51-47 percent in the most current election, a major reduction from the 54-38 percent spread he posted four years earlier.

While Trump declined in the suburbs, his performance among rural voters was even stronger than his 2016 benchmark. In 2020, Trump’s percentage among rural voters rose to 65 percent from his 59 percent previous showing. Additionally, rural female voters largely account for his overall increase among women as he moved from 39 percent in ’16 to 44 percent in 2020.

Continue reading

The Presidential Debates Loom

By Jim Ellis

Sept. 1, 2020 — The Presidential Debate series looms on the political horizon, and controversy is beginning to swirl even though the first forum is still a month away.

The first in a series of currently three presidential debates is set for Sept. 29.

House Speaker Nancy Pelosi said last week that Democratic nominee Joe Biden shouldn’t debate President Trump. “I wouldn’t legitimize a conversation with him, nor a debate in terms of the presidency of the United States,” she was quoted as saying at a news conference.

At the end of July, former Bill Clinton news secretary Joe Lockhart wrote for CNN.com that Biden shouldn’t debate the president. “Whatever you do, don’t debate Trump. Trump has now made more than 20,000 misleading or false statements according to the Washington Post,” Lockhart penned as public advice to Biden.

Some on the Republican side argue that these Democratic leaders are beginning to lay the groundwork for Biden to avoid the debates because of concerns their candidate would fare poorly opposite President Trump.

For his part, Biden says he will debate the president, and become his own “fact checker on the floor.” He will also begin holding campaign events after Labor Day. In an Aug. 28 interview with the Associated Press, Biden said he’ll “meet people where it matters – not at irresponsible rallies or staged for TV to boost egos, but real people’s communities, in real local businesses, in their lives.” Biden further said he’ll “hold events consistent with the state rules about crowd sizes and other regulations.”

The first debate is scheduled for Tuesday, Sept. 29, the second on Thursday, Oct. 15, and the final forum culminates a week later on Oct. 22. The vice presidential debate between incumbent Vice President Mike Pence and Sen. Kamala Harris (D-CA) is scheduled for Wednesday, Oct. 7.

The debates have proven important in the past and always draw large audiences. According to the Pew Research Center, even the first televised debate, between then-Sen. John F. Kennedy and then-Vice President Richard Nixon, drew over 66 million viewers usually on black and white televisions, at a time when the US population was just under 181 million people, or approximately 55 percent of today’s total populace.

Continue reading

Coronavirus Polling Numbers

By Jim Ellis

COVID-19 virus

June 30, 2020 — The Pew Research Center yesterday released the results of their national poll about how the public is viewing the COVID-19 response, which enables us to put the data in a political context. The polling results contain some good news for both presidential candidates and the respective major party leaders who are attempting to craft national campaign agendas in unique times.

According to the Pew methodology report on page six of their synopsis, the survey was conducted from June 4-10 via “the American Trends Panel (ATP), as created by the Pew Research Center, [which] is a nationally representative panel of randomly selected U.S. adults. Panelists participate via self-administered web surveys.” The ATP has a total of 19,718 adults of which 11,013 were sampled for this poll and 9,654 responded.

The sampling error is reported to be plus or minus 1.6 percentage points, but Asians (8.2), Blacks (5.3), and Hispanics (4.5) were well over the average. While the pollsters show all segments falling between a plus or minus 1.8 and 8.2 error factor, they still list the overall sample rate (1.6 percent) as falling below even the low number on racial segmentation.

The best news for former vice president Joe Biden is that the Trump Administration scores the lowest rating relating to whom and what the respondents trust most about coronavirus information. The administration is believed either almost all (eight percent), most (21 percent), or some of the time (29 percent) by a combined 58 percent of the respondents. In contrast, the Center for Disease Control is the most reliable cited source with a combined 88 percent rating (22 percent almost all; 42 percent most; 24 percent some of the time).

With President Trump and his team scoring low on the believability scale, the better news for his campaign is that fewer people are following the disease coverage closely. Furthermore, it is clear that large segments don’t know what to believe from news accounts of the disease’s effects.
Continue reading

Mail Voting Polarization

By Jim Ellis

COVID-19 virus

May 4, 2020 — The COVID-19 pandemic has greatly affected everyday life, going even so far as touching American voting procedures. Before the pandemic hit, for example, just four states conducted their elections exclusively through the mail (Oregon, Washington) or predominantly so, meaning having few polling places (California, Colorado).

With so many early primary states postponing their primary elections in conjunction with the disease precautions, we now see either all-mail systems, or including the mail option for all voters, being utilized for upcoming primary elections in 20 additional states, and the list keeps growing.

Predictably, progressive left voter organizations are using the pandemic as a catalyst to push for their long-term election systemic goals. Lawsuits around the country are being filed in such places as Indiana, Pennsylvania, Texas, and several other states, to expand the all-mail option from the primaries into the general election. And, once the all-mail system has been instituted in places around the country, thus establishing it as an electoral fixture, the process becomes much easier to make permanent.

Additionally, we are seeing further lawsuits filed to include automatic voter registration, prohibiting the purging of registration names of people who consistently haven’t voted in multiple elections, and the controversial ballot harvesting idea that allows any voter to collect ballots and deliver them to election authorities.

The Pew Research Center just completed a nationwide survey, testing the population about their attitudes and perceptions of these types of procedural issues. It came as no surprise that the survey results produced rather polarizing responses from the self-identified affiliates of the two major political parties, since virtually every contemporary issue yields deep divides between the partisans.

Continue reading

Will Michigan & Wisconsin Voters Determine 2020 Presidential Election?

By Jim Ellis

April 6, 2020 — Polls were just released in both Michigan and Wisconsin, obviously two critically important states that will weigh heavily in determining the final outcome of the next presidential election. While it’s too early to take any general election poll as a true projection of what may happen in November, particularly in light of the current unique situation, the survey did reveal some interesting points.

Progress Michigan’s Lake Effect newsletter: “The governors’ approval ratings pertaining to the [coronavirus] crisis are better than those of the president.”

Public Policy Polling tested the Michigan electorate for the Progress Michigan progressive left organization (March 31-April 1; 1,01 registered Michigan voters) and Marquette Law School just completed their quarterly survey of Wisconsin voters (March 24-29; 81 registered Wisconsin voters). Both made public their results.

We won’t pay too much attention to the ballot tests because it is so far away from the actual vote and the political situation is obviously going to change during the coming months, but the two pollsters found President Trump and former vice president Joe Biden within the margin of error in each state. In both cases, it was Biden who enjoyed a three-point lead.

Within this prism, it is important to recall the 2016 race in which polling badly underestimated Trump’s strength against Hillary Clinton in these two places. According to the 270 To Win organization, which tracked polling throughout that election year, the final averages going into the final weekend found Trump trailing by six points in Michigan and seven in Wisconsin. He won each state by approximately one percentage point, thus proving a large error factor in virtually all of the late polling.

A post-election analysis in which the Pew Research Center and CNN participated, among other firms and media outlets, concluded that a major reason for the flawed projections were the much larger number of Democrats willing to respond to the polling questions than Republicans. Even understanding this was the case at the time, the pollsters’ weighting formulas and algorithms still badly missed the mark throughout the crucial Great Lakes region.

Continue reading

Succeeding Georgia’s Sen. Isakson

By Jim Ellis

Georgia Sen. Johnny Isakson (R)

Aug. 30, 2019 — Georgia Sen. Johnny Isakson (R), first elected to the Senate in 2004 after spending six years in the US House and 18 years in the Georgia legislature, announced Wednesday that he will resign his seat at year’s end due to serious health problems.

The news stories have reported the details surrounding Isakson’s departure and his health status, but the succession situation will be the concentration of this update. The development means that both of Georgia’s Senate positions will be on the ballot in 2020. The two will run only semi-concurrently, however.

The first step is for Gov. Brian Kemp (R) to appoint a replacement for Sen. Isakson. The governor will install an interim senator to serve from Jan. 1 until the appointed individual or another is elected. It is believed that the governor will name his choice quickly so that the person will have a transition time to work with Isakson and his staff before assuming the office.

While Sen. David Perdue stands for a second term in the regular cycle, meaning a May 19, 2020 primary followed by a July 21 run-off if no candidate secures majority support in the initial vote, the special election will follow a different format and slightly altered schedule.

The regular general election is, of course, Nov. 3, 2020, but Georgia is also one of the few states that holds a post-election run-off in case no one receives majority support. That run-off will be held Jan. 5, 2021, but it is unlikely that the Perdue race would advance through to such a process regardless of who wins the November vote.

The Isakson seat, however, will not follow the same calendar or system. Since this is a special election called to fill the balance of the current term, which will last until the beginning of 2023, a jungle primary is to be held concurrently with the November election, and the top two individuals, regardless of political party affiliation, will advance to the Jan. 5 run-off if no one receives a majority vote in the first election. For this seat, the odds of seeing a run-off election intensify because a crowded field is expected, thus making it more difficult for any one individual to secure majority support.

One person who will not be competing is former Democratic gubernatorial nominee Stacey Abrams, the former state House Minority Leader. Abrams indicated that she will not be a Senate candidate in either seat next year, preferring to remain focused in her role of working with voter registration and turnout organizations.

Continue reading

The Committed Choices

By Jim Ellis

Aug. 21, 2019 — The Pew Research Center conducted a national poll, of which many Democratic presidential primary questions were asked, but one was particularly interesting.
The survey was taken from a universe of 5,766 panelists who agreed to respond to online Pew polls. For this study, conducted during the July 22 through August 4 period, 4,175 of those individuals did in fact respond, or 72.4 percent of those queried. From this respondent subset, 1,757 individuals who self-identified as Democrats or Democratic-leaning voters were questioned about the presidential primary.

The ballot test was not particularly noteworthy in that the results were mostly in line with other national polls being reported within the same time frame. According to Pew, former Vice President Joe Biden led the group, but with just a 26 percent preference score, followed by Sen. Elizabeth Warren (D-MA) at 16 percent, Sen. Bernie Sanders (I-VT) posting 12 percent, and Sen. Kamala Harris (D-CA) claiming 11 percent support. All others, including South Bend Mayor Pete Buttigieg polled in single digits.

But the most interesting question had to do with the individuals’ committed choices. The group was asked about their enthusiasm toward the candidates and whether they were attracted to only their stated choice or if other Democratic contenders also excited them. This question was asked to gauge strength of support.

The aggregate response showed that 35 percent were only enthused about their candidate of choice, while 63 percent said several of the candidates enthused them. Though he finished a rather distant third on the overall ballot test, it is Sen. Sanders who registers the most committed support.

A majority of the Sanders voters, 51 percent, responded that they are only enthused about his candidacy and feel the same about none of the other Democratic contenders. He is the only candidate to command a such a high committed support percentage.

Biden registered 45 percent who said they are only enthused for him, but 53 percent said others attracted their attention, as well. The candidate who had the least committed support, despite her defined rise in most national polls, was Sen. Warren. Only 19 percent of her voters say they are only committed to her, while 80 percent of her contingent are also enthused by other candidates. Sen. Harris scored slightly better, with 22 percent saying only she enthuses them, while 78 percent of her voters see other candidates they also like.

Continue reading

Understanding Independent Voters

By Jim Ellis

March 20, 2019 — In most elections, particularly in today’s polarized political climate, the independent vote is often the determining factor. As the non-affiliated share grows within the American electorate, these individuals become even more important.

But, who are the independents and how different are they from the average partisan Republican or Democrat? The Pew Research Center released a new study at the end of last week about the independent voter. Their data sources were a compilation of polls taken during the past few years, up to and including 2019.

The Pew conclusions are interesting in that the study basically reveals the lion’s share of independents align very closely with partisan Republicans and Democrats. Or, in other words, they generally vote with one party or the other, hold similar views and values as one of the major parties, but don’t want to associate themselves with the particular entity.

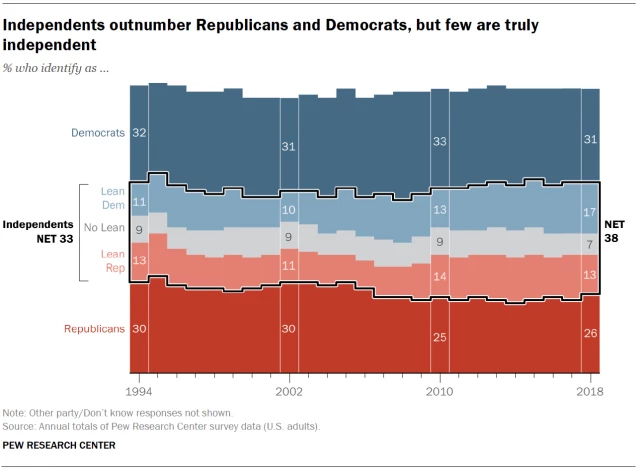
Based upon the sourced data, Pew denotes that approximately 38 percent of the electorate considers themselves to be independent. This compares with 31 percent who self-identify as Democrats and 26 percent who say they are Republican. Within the aggregate independent segment, 46 percent align with the Democrats while 35 percent identify with Republicans. Therefore, 19 percent of this group can be considered the true swing voter.

While those identifying more closely with the Republican Party are fewer, they have a higher voter turnout proclivity. According to the 2018 midterm election statistics, 54 percent of the Independent/Lean Republicans cast a ballot versus 48 percent of those generally identifying with the Democrats. The greater turnout figure for Republicans, even in a more Democratic year like 2018, suggest that the two parties are basically at parity within the independent voting sector.

Continue reading

Analyzing the 2018 Vote

By Jim Ellis

Dec. 5, 2018 — The Pew Research Center recently released a series of reports about the 2018 electoral patterns that allow us to better understand what happened in last month’s voting.

Clearly, the election produced mixed results: Republicans gained two seats in the Senate; Democrats reached near-wave proportions in the House; Democrats converted a net seven governorships, yet only scored new majorities in six legislative chambers and produced at least temporary redistricting control in just one state (Colorado).

But, why did these unusual results happen? The Pew findings provide us clues.

Among college-educated women, according to the Pew research, 59 percent voted Democratic for the House of Representatives as compared to only 39 percent choosing the respective Republican candidate. College-educated men broke 51-47 percent for the Republican congressional candidate. Compared to other years, college-educated women, who normally break Democratic, did so to a greater degree in 2018, whereas college-educated men failed to reach Republican margins typically found.

Therefore, Democratic strategists, who heavily weighted the highly educated segment believing a turnout surge within this sector would occur, proved correct.

Perhaps indicative of how the Republicans performed, the Pew study uncovered a segment of voters that showed that only 10 percent of Republican voters mentioned economic policies in explaining their vote motivation with only two percent citing the “good economy.”

Continue reading