By Jim Ellis

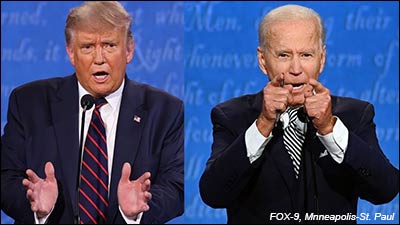
The candidates in action at the first presidential debate in Cleveland, Ohio: President Donald Trump (left) and former vice president Joe Biden.
The study, conducted just after the November election (Nov. 7-12; 11,818 individuals through groups of screened panelists, online) was exhaustive.
Quoting the methodology description, “noncitizens and those who refused the citizenship question (N=450), voters who refused to answer the vote choice question (N=84) and panelists who declined to provide their names and thus could not be matched to a voter record (N=139) were removed, leaving 11,145 panelists for analysis.” Of this latter number, 9,668 respondents were validated as voters, meaning the research team verified with a local election office that the particular individual had in fact voted.
The basic voter segmentation conclusions were speculated upon in most media sectors during the early post-election period, but this research validates and expands upon the discovered patterns. Largely, President Biden received a significant boost from suburban voters, which proved the major difference in his increasing Democratic popular vote performance.
Despite losing the popular vote by a substantial margin, former President Trump surprisingly improved his standing with several groups such as Hispanics, Asians, black men, young voters, and women, but not to the degree necessary to counter Biden’s strength with suburban voters.
For example, among suburban voters, according to the Pew research, Biden recorded 54 percent support as compared to Hillary Clinton’s 45 percent in the 2016 election. Conversely, Trump only carried white voters 51-47 percent in the most current election, a major reduction from the 54-38 percent spread he posted four years earlier.
While Trump declined in the suburbs, his performance among rural voters was even stronger than his 2016 benchmark. In 2020, Trump’s percentage among rural voters rose to 65 percent from his 59 percent previous showing. Additionally, rural female voters largely account for his overall increase among women as he moved from 39 percent in ’16 to 44 percent in 2020.
Within the following segments President Biden improved upon Hillary Clinton’s 2016 performance:
| Independents | |
|---|---|
| 52% – Biden | 42% – Clinton |
| Moderate/conservative Democrats | |
| 91% – Biden | 85% – Clinton |
| Catholics | |
| 49% – Biden | 44% – Clinton |
| White Catholics | |
| 42% – Biden | 31% – Clinton |
| Unaffiliated (religious) | |
| 71% – Biden | 65% – Clinton |
In the other tested segments, Biden and Ms. Clinton’s numbers were within the same realm.
Segmentation groups where Trump significantly improved from his 2016 performance were the following:
| Hispanics | |
|---|---|
| 28% (2016) | 38% (2020) |
| High School or less | |
| 51% (2016) | 56% (2020) |
| Millennials (1981-’96) | |
| 31% (2016) | 39% (2020) |
| Urban voters | |
| 24% (2016) | 33% (2020) |
| White Evangelicals | |
| 77% (2016) | 84% (2020) |
Interestingly, though Biden outperformed Ms. Clinton at a 10 percent level among Independents, Trump’s percentage remained constant at 43 percent in both 2016 and 2020.
Finally, how people cast their ballot is now becoming a segmentation cell. Mail voting and in-person election day voting produced polar opposite results.
Among those voting early by mail, Biden posted a 65-33 percent support margin. For those voting in-person on election day, the margin remained constant but flipped. Within this group, Trump posted an identical 65-33 percent spread. Those voting early in-person proved to be the swing group. This segment broke 52-47 percent for Biden.
Studies such as this Pew research project not only better tells us what happened in the pivotal 2020 election but provides a roadmap as to the voter groups that each party will target in order to improve their prospects for the coming 2022 crucial midterm elections.
