By Jim Ellis — Monday, July 6, 2026
Redistricting
 Big predictions were made early in the year from both Democrats and Republicans as to how their side would perform in the newly drawn congressional districts particularly in California and Texas.
Republicans said they would gain five seats in Texas, while the California Democratic map was designed to neutralize that advantage. Are the new districts in both states so far performing as predicted?
Looking at the California jungle primary vote figures and general election statistical projections and polling in Texas, we can begin to determine if the benchmarks will be met.
First, the California districts: the plan was to convert Republican seats in Districts 1 (the late Rep. Doug LaMalfa and now Rep. James Gallagher), 6 (Rep. Kevin Kiley), 22 (Rep. David Valadao), 38 (open seat due to pairing Reps. Ken Calvert and Young Kim in new District 40), and 48 (open seat because of Rep. Darrell Issa’s retirement).
Though California’s slow counting and certification process for the June 2 jungle primary is still not finished, most ballots have now been scanned and tabulated giving us a clear picture of the November landscape.
In the northern 1st District, Rep. Gallagher easily won the June 2 special election outright in the previous 1st CD, but the November election in the new 1st will likely produce a different outcome. While Rep. Gallagher (R-East Nicolaus) leads state Sen. Mike McGuire (R-Sonoma County) in the jungle primary by 854 votes, the aggregate Democratic vote (three candidates) combined for 56.8 percent, suggesting that the new Republican Congressman has a major hill to climb if he is to win a full term in November.
In the Sacramento-anchored 6th District, Rep. Kiley is running as a No Party Preference (NPP) candidate, though he still caucuses with Republicans. He finished first in the jungle primary with 24.3 percent of the vote. For a time, it appeared that Rep. Kiley and Republican Michael Stansfield would both advance, but former state Sen. Richard Pan (D) ultimately claimed the second spot. The aggregate Democratic vote among four candidates is 54.1 percent, making Kiley an underdog heading into the general election.
Rep. David Valadao (R-Hanford/Fresno) has repeatedly won in a Democratic-leaning Central Valley district, losing only in 2018 before reclaiming the seat in 2020 and winning again in 2022 and 2024. Dave’s Redistricting App (DRA) rates the new 22nd District at 52.1D – 47.2R, an improvement for Republicans compared to the previous 55.5D – 42.6R configuration. Yet in the jungle primary, Valadao took just 40.7 percent of the vote, while his two Democratic opponents combined for 59.3 percent.
Even so, Rep. Valadao has a track record of surviving in tougher districts than the new CA-22.
The new 38th District is solidly Democratic (DRA partisan lean: 57.1D–41.9R), positioning Los Angeles County Supervisor and former Rep. Hilda Solis (D) for an easy general election win. In the jungle primary, Solis received 47.6 percent of the vote, and the combined Democratic share from three candidates reached 64.2 percent. As a conversion district, the 38th is almost certain to move into the Democratic column in November.
In the new 48th District, opened by Rep. Issa’s retirement, Republicans still have a plausible path to holding the seat with San Diego County Supervisor Jim Desmond. In the primary, Desmond led San Diego City Councilwoman Marni von Wilpert, 38.9 –20.8 percent, but the aggregate Democratic vote (nine candidates) was 54.1 percent.
Desmond already represents much of the new, largely rural 48th, which now ventures from San Diego County into Riverside County. The district does not include any part of San Diego city, meaning von Wilpert must build new relationships in unfamiliar territory. This race is one to watch in November.
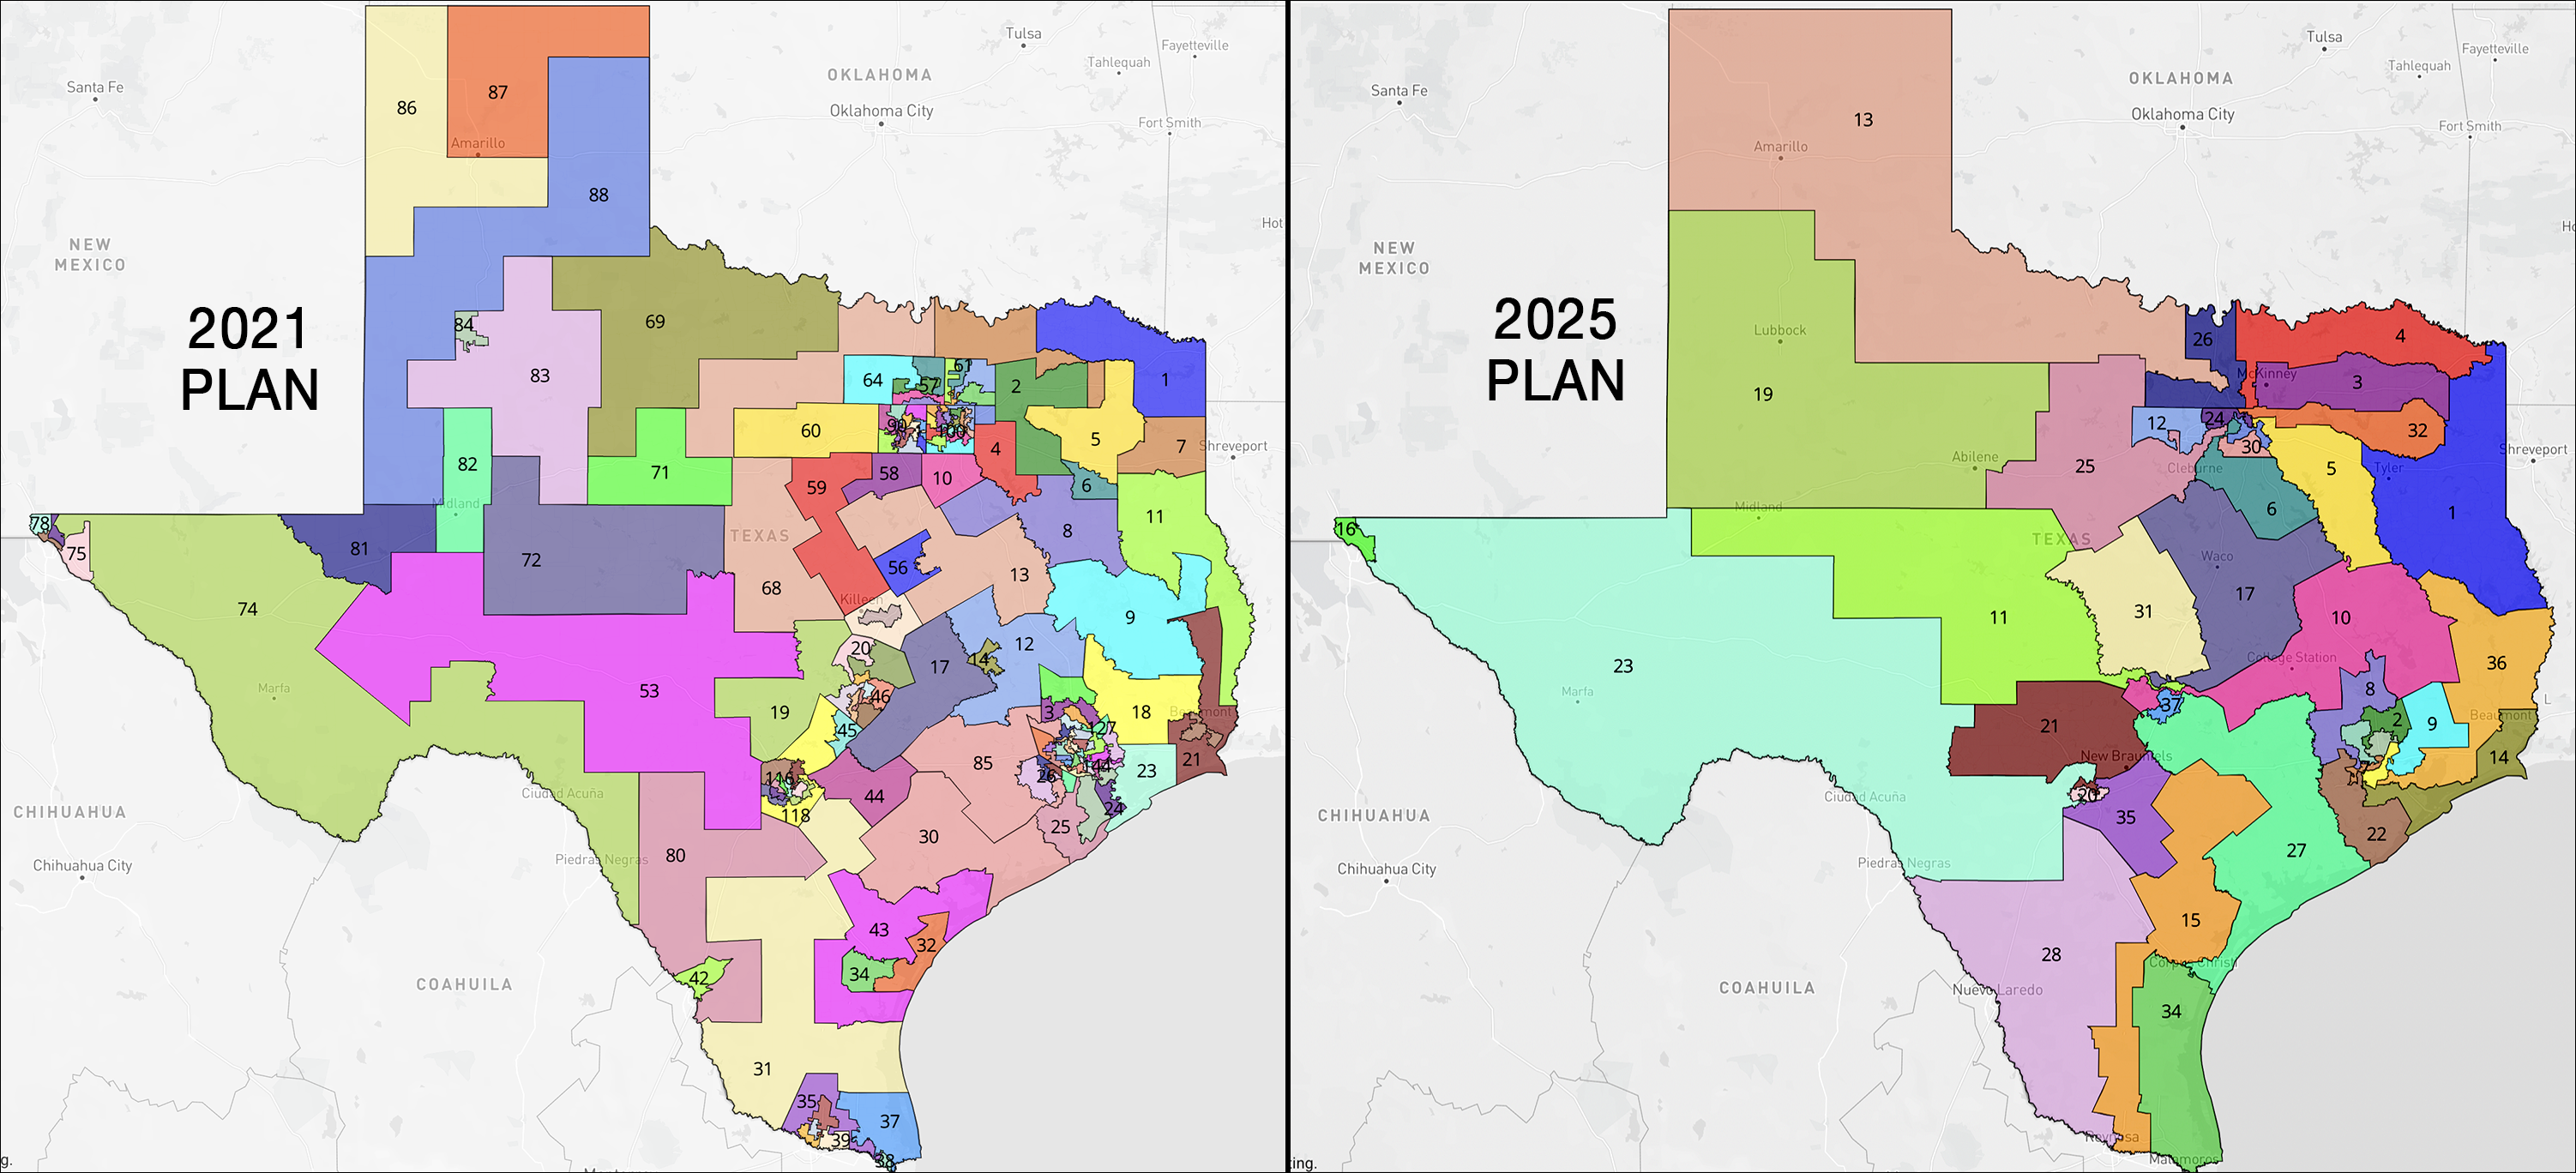
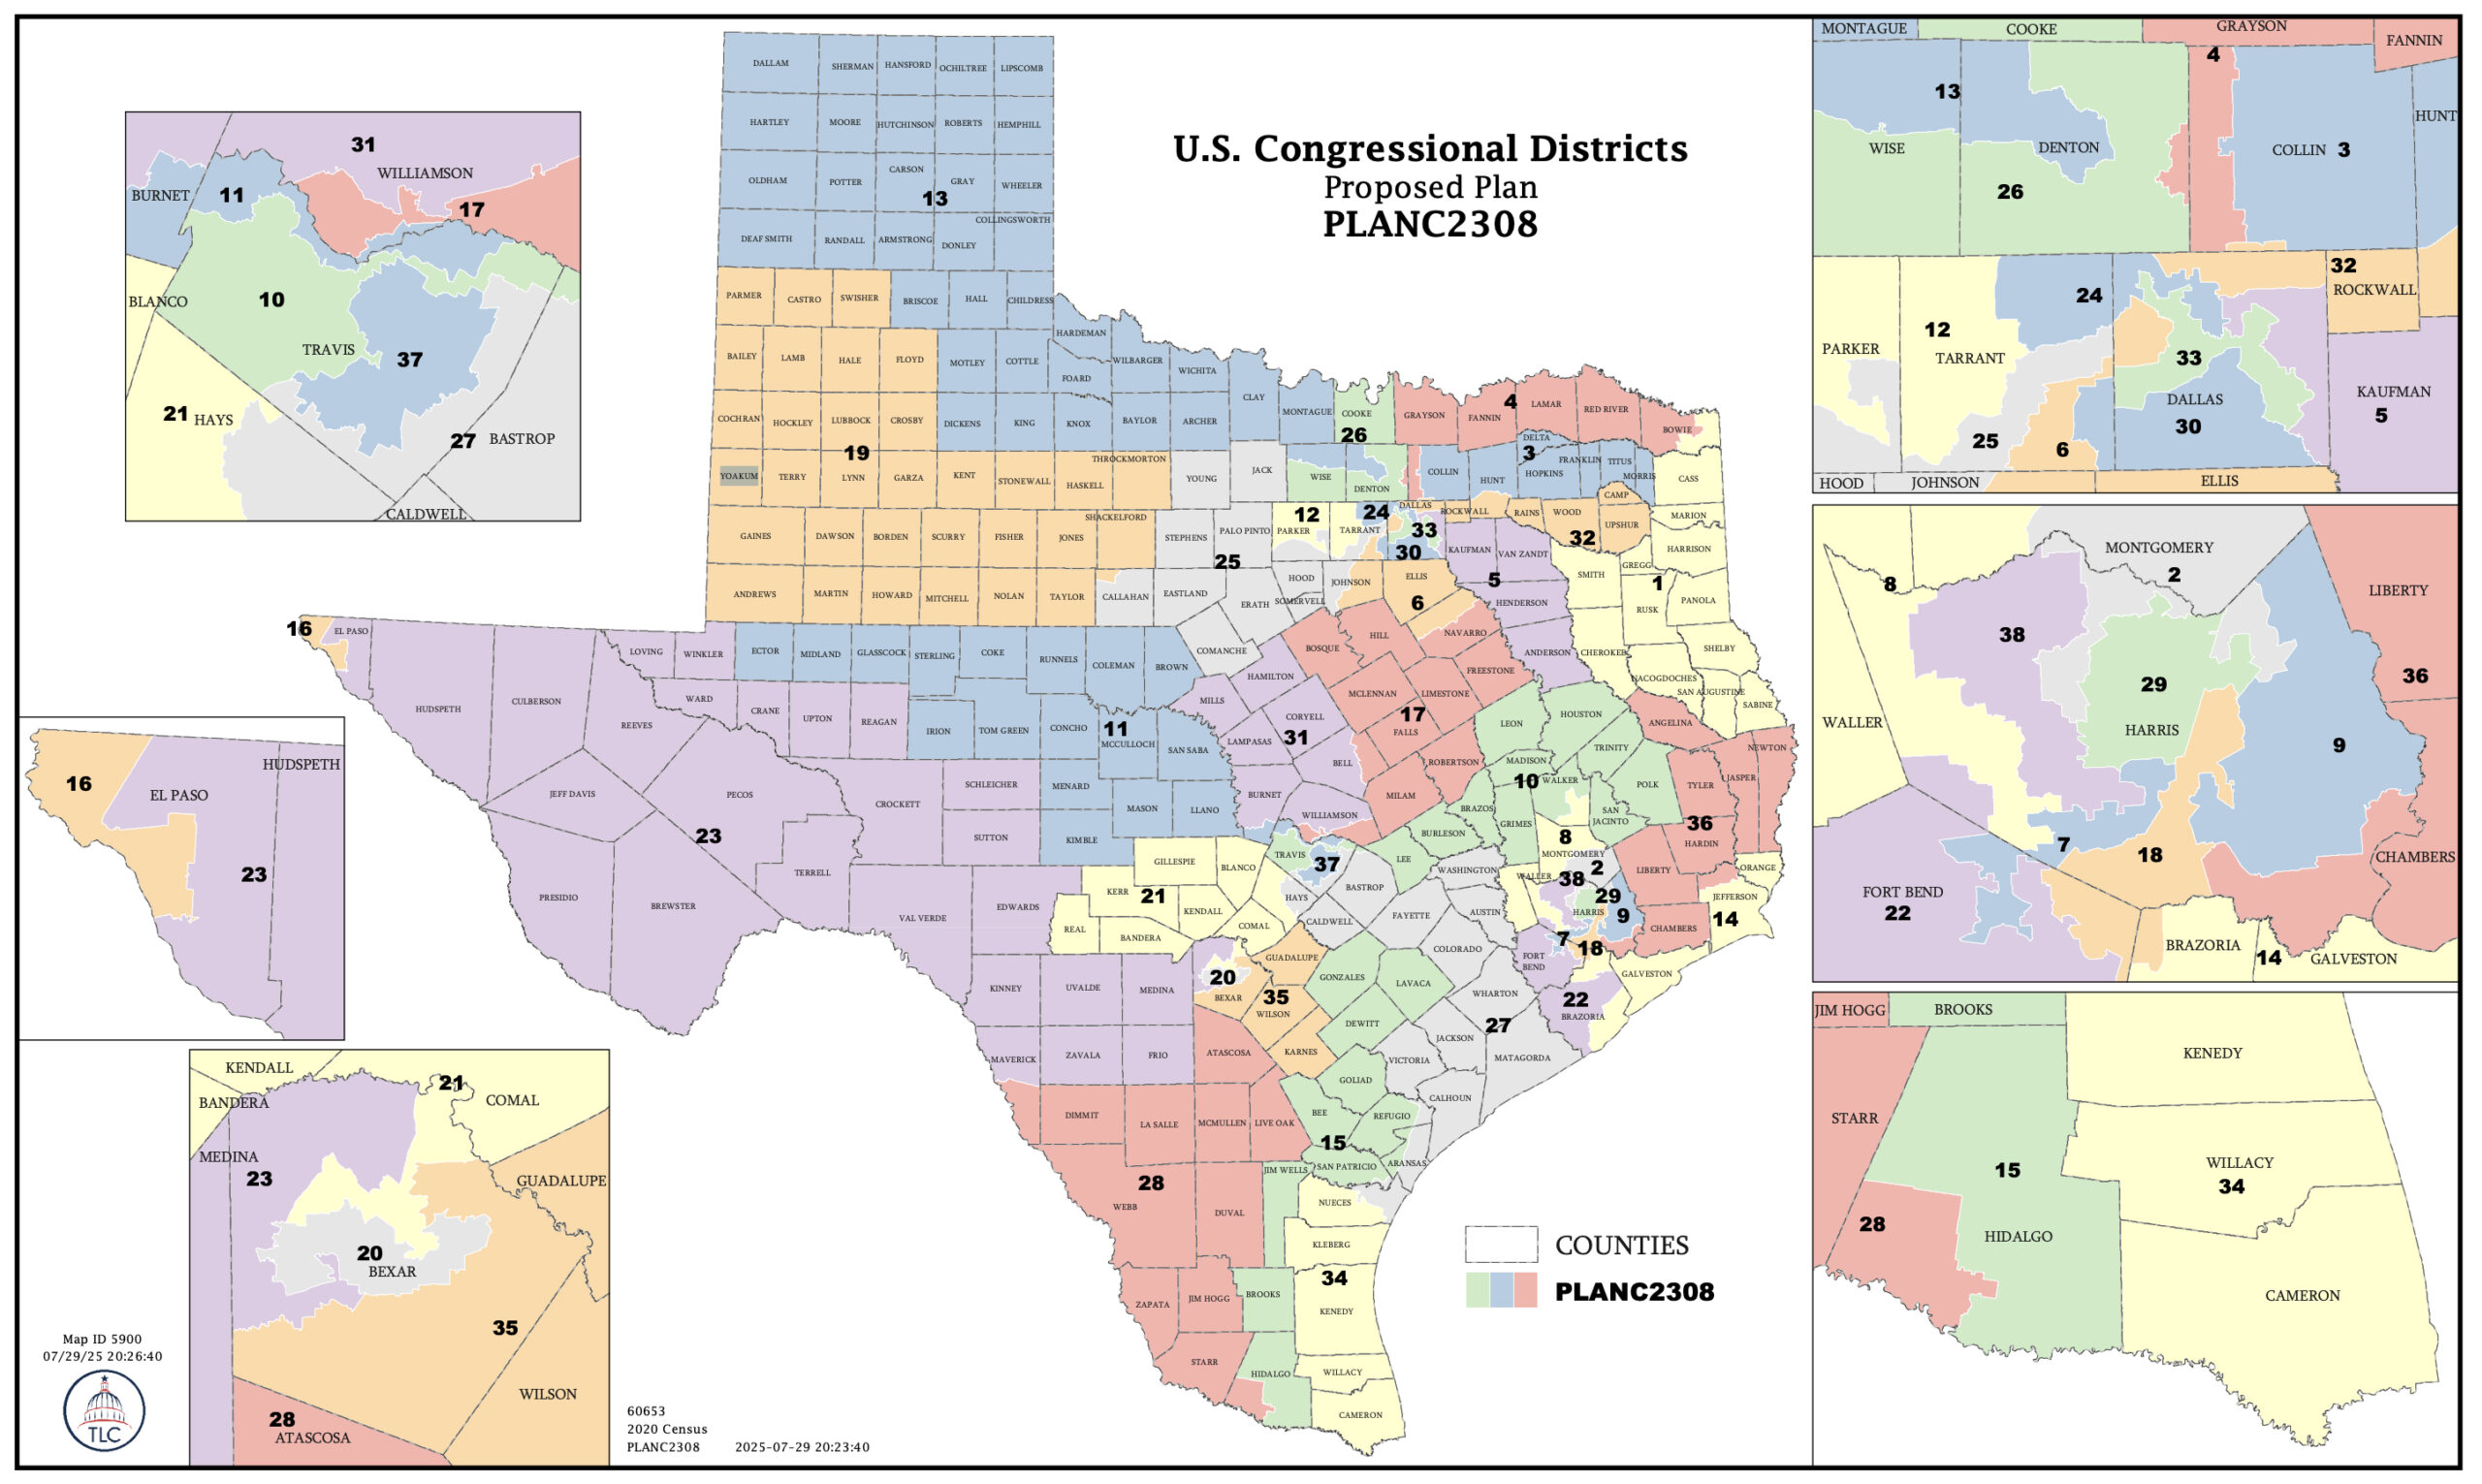
In Texas, Republicans are targeting Districts 9 (an open seat created by pairing Reps. Al Green and Christian Menefee in new District 18), 28 (Rep. Henry Cuellar), 32 (Rep. Julie Johnson), 34 (Rep. Vicente Gonzalez), and 35 (an open seat resulting from pairing Reps. Lloyd Doggett and Greg Casar in new District 37). GOP candidates in Districts 9 and 32 – investment banker Alexandra Mealer and attorney and Space Force veteran Jace Yarborough – should be considered clear favorites to flip their seats.
In the 28th District, a Pulse Decision Science poll of 400 likely voters shows Republican challenger and Webb County Judge (Executive) Tano Tijerina leading Rep. Henry Cuellar (D-Laredo), 46-38 percent. The GOP appears to have recruited its strongest possible candidate against Cuellar, and if this survey is accurate, Judge Tijerina has a strong chance to deliver a Republican pickup in November.
In the Brownsville-based 34th District, a Ragnar Research Partners poll (June 14-16; 400 likely voters; live interviews) finds Republican challenger Eric Flores running ahead of Rep. Gonzalez (D-McAllen), 44-41 percent, in a race widely viewed as a toss-up.
Finally, in the new San Antonio-anchored 35th District – rated by DRA at 50.9R – 46.7D – Republican businessman Carlos De La Cruz, brother of Rep. Monica De La Cruz (R-McAllen), appears to hold at least a slight edge over Bexar County Sheriff’s Deputy Johnny Garcia (D).
Taken together, the emerging results in California and Texas suggest that both new congressional maps are largely performing as drawn. However, given the close margins and competitive dynamics in several districts, each state still has the potential to produce at least one notable November upset.