Tag Archives: California

Projected Democrat Delegate Count

By Jim Ellis

Aug. 12, 2019 — Several polls in key states have been released in early August, so it is a good time to again review the Democratic presidential delegate count estimate based upon the available data.

Projected delegate counts based on polling in nine key states of Democratic candidates jockeying for their party’s nomination for president in 2020.

We see new polls from Iowa, New Hampshire, California, Texas, North Carolina, Washington, and Pennsylvania. Adding the numbers from Nevada and South Carolina — important because this pair is part of the momentum setting First Four — we can gain a decent, though not wholly accurate, picture of where the race would stand if delegate apportionment were based upon these polling totals.

The most current surveys come from North Carolina, Iowa, and Pennsylvania all conducted between July 29 and Aug. 5.

In chronological order, based upon the latest studies, we begin with the Tar Heel State. Survey USA polled the North Carolina Democratic electorate (Aug. 1-5; 534 likely North Carolina Democratic primary voters) and find former Vice President Joe Biden leading his opponents by 21 points. He would post 36 percent as compared to Sens. Bernie Sanders (I-VT) and Elizabeth Warren (D-MA) scoring 15 and 13 percent, respectively. All others fall to single digits.

Accounting for some of the lower-tier candidates eventually dropping out before voting begins, it is likely that the three listed above would exceed the 15 percent threshold to qualify for delegates. If so, Biden would capture approximately 62 delegates, Sen. Sanders would earn 26, and Sen. Warren, 22.

Monmouth University conducted a new Iowa poll (Aug. 1-4; 401 likely Iowa Democratic caucus participants) and found much different results than when we last visited this electorate through the Change Research data in July. Those results projected the top five candidates qualifying for delegate apportionment, but Monmouth sees things quite differently.

According to their latest numbers, it is only Biden and Sen. Warren who would exceed the 15 percent threshold and qualify for delegates, polling at 28 and 19 percent respectively. Therefore, Iowa’s 41 first ballot delegates would split 24 for Biden and 17 for Warren.

Continue reading

Seven State Polls

By Jim Ellis

Aug. 2, 2019 — In the latter half of July, several different pollsters conducted Democratic presidential primary polls in seven important primary states. In Iowa, New Hampshire, South Carolina, California, Texas, Michigan, and Illinois — all states whose voters will cast primary ballots on or before March 17 — contain an aggregate 1,012 first-ballot delegates.
The seven polls give us an idea as to how Democratic primary participants in the corresponding states would vote if their presidential nomination elections had been in mid to late July. Additionally, we make delegate dispersion projections from the polling data to the qualified candidates and attempt to determine whether any one individual could garner the 50 percent delegate support necessary to claim a first ballot victory.

The Firehouse/Optimus organization polled in Iowa (July 23-25; 630 likely Iowa Democratic caucus voters), New Hampshire (July 23-25; 587 likely New Hampshire Democratic primary voters), and South Carolina (July 23-25; 554 registered South Carolina voters). The Public Policy Institute of California surveyed the Golden State Democratic primary (July 14-23; 766 likely California Democratic primary voters). The University of Texas at Tyler (July 24-27; 554 registered Texas voters), Climate Nexus (July 14-17; 324 likely Michigan Democratic primary voters), and Victory Research (July 26-29; 1,200 likely Illinois Democratic primary voters) tested the Texas, Michigan, and Illinois electorates.

For the purposes of this exercise, let us assume that all of these surveys accurately depict how the Democratic electorates in each of these states would vote. Let us further assume that the congressional district delegate apportionment directly corresponds to the at-large state vote.

Doing so allows us to make delegate apportionment estimates for each of these states with the understanding that the conclusions are not precise. They do, however, give us an idea as to how the delegate dispersion might break. Understanding that several of the polled minor candidates will not be on the ballot when actual voting occurs allows us to project additional votes going to the close finishers, those at 13-14% in these polls. Doing so likely boosts them to the 15 percent threshold that party rules mandate as a qualification requirement for delegate votes.

The aggregate total of 1,012 delegates from these seven states represents just under 27 percent of the entire first ballot universe at the Democratic National Convention, so the combined tested states are significant in terms of the number of delegates they possess and their voting schedule position.

Continue reading

Q2: The Money Count – House

By Jim Ellis

The top Democratic fundraiser in the House for Q2 was New York freshman Rep. Alexandria Ocasio-Cortez (D-Bronx), with $1.22 million raised from April 1 – June 30.

July 23, 2019 — Yesterday we covered the fundraising and cash-on-hand figures for the 2020 Senate campaigns; today we look at the House.

The Daily Kos Elections site surveyed the entire House universe and segmented the large group into a competitive race category. They find 158 House incumbents who will be in a competitive 2020 campaign or have the potential of being in one at this point in time.

Within this incumbent segment, the aggregate amount raised is over $61.4 million for the second quarter period ending June 30. As one would expect, the majority Democratic members had the larger haul, $39.4 million for the 94 Democrats surveyed as compared to $21.9 million for 64 Republicans. The average amount a Democratic member raised was just over $419,000 as compared to $342,000 for Republicans.

As was the case in 2018, when fundraising records were shattered for US House incumbents and candidates, this election cycle appears to be again featuring candidates who are prolific in this campaign element. For the campaign cycle-to-date aggregate figure, meaning the amount of money raised from Nov. 9, 2018, the day after the last general election, to June 30, 2019, these same incumbents have raised over $135 million, meaning an average of just under $855,000 per member.

For the 94 Democratic incumbents isolated for this report, just over $75 million was raised campaign-to-date, for an average of almost $798,000 per member. The 64 Republicans attracted an aggregate $41.4 million, with an average of $646,000 raised CTD.

In terms of current cash-on-hand, the average competitive, or potentially competitive, Democratic House incumbent posted almost $1 million CoH, or $987,000. Their Republican counterparts averaged $657,000. While Democrats have a clear money advantage, is it equally evident that the GOP candidates will also have more than enough to communicate their message. These figures obviously do not include the large amount of money that outside organizations will raise and spend independently to boost their favored candidates of both parties.

Continue reading

California Tightening

By Jim Ellis

July 19, 2019 — Two new surveys of the California Democratic electorate show the presidential race tightening in the state that possesses the largest delegation to the Democratic National Convention: 416 first-ballot delegates. To highlight the state’s size within the convention universe and its importance to the nomination process, the next largest state, Texas, has 228 first-ballot delegates.
The latest Quinnipiac University poll (July 10-15; 1,125 registered California voters, 519 likely Democratic primary voters) finds home-state Sen. Kamala Harris (D-CA) leading the pack of candidates with 23 percent of the vote. In second place is former Vice President Joe Biden who has 21 percent with Sen. Bernie Sanders (I-VT) posting 18 percent support. Following is Sen. Elizabeth Warren (D-MA) who recorded 16 percent. South Bend Mayor Pete Buttigieg falls all the way to three percent just ahead of New York City businessman Andrew Yang who registered two percent preference.

The Capitol Weekly survey (July 1-15; 816 likely California Democratic primary voters), with a larger polling sample, arrives at similar results. According to the CW data, Sen. Warren has the lead with 25 percent, just ahead of Sen. Harris and Biden who both command 20 percent, while Sen. Sanders posts a close 16 percent. In this poll, Mayor Buttigieg does much better, eight percent, but is nowhere close to qualifying for delegates at the 15 percent minimum threshold.

While these polls are different in candidate order, they both suggest that the top four candidates are currently running close and each would qualify for a substantial share of the large first-ballot delegate contingent.

Available polling data can be used to provide a rough extrapolation model of the early delegate count, examining the latest surveys in the first five voting states to provide at least some measure about how close this race might become if the support patterns we see today continue into the early voting period.

The delegate apportionment process comes in two distinct categories: the at-large delegates who are tied to the statewide vote, and those coming from each congressional district, which range from four to seven delegate votes apiece in California, for example. The latter delegates are apportioned by the individual congressional district popular vote, with those candidates who receive at least 15 percent of the vote in the particular CD qualifying for the district delegate apportionment.

Continue reading

The Early Delegate Projections

By Jim Ellis

June 25, 2019 — There have been several important state polls recently released that provide us data about where the Democratic presidential candidates stand in relation to popular preference. But that is only half the story.

In order to gauge where the candidates might stand in terms of delegate apportionment, we have taken the available published polls from 16 states and began extrapolating a reasonable delegate projection for each.

For purposes of this exercise, all of the polling data is considered accurate, even though in some instances such a conclusion is a stretch. Additionally, these projections were only based upon the at-large numbers but understand more than half of the delegates come from the state’s chosen districts (usually congressional district, though Texas uses their state Senate seats).

It is reasonable to believe, however, that the district apportionment will, in most cases, be similar to the statewide total. At this point, the at-large ratios are the only data set from which we can begin to draw statistical conclusions.

With that short background, the states and their most recent polling result are listed below along with our unofficial delegate projections listed in chronological order based upon voting schedule:

February 3

Iowa Caucus

(YouGov – May 31-June 12; 587 likely Iowa Democratic primary voters)
• First-Ballot Delegates: 41

Biden 30%
Sanders 22%
Warren 12%
Buttigieg 11%

Delegate Projection:

Biden 15
Sanders 11
Warren   8
Buttigieg   7

Continue reading

Polling vs. Delegates:
“The Game Within the Game”

By Jim Ellis

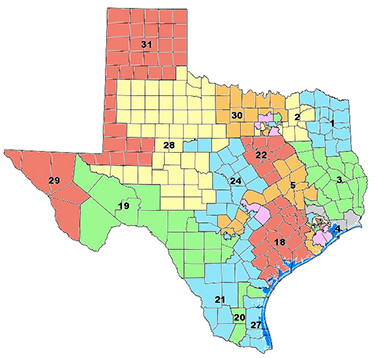
Texas state senate districts

June 7, 2018 — Quinnipiac University released their latest Texas poll (May 29-June 4; 1,159 registered Texas voters) and it finds former Vice President Joe Biden doing well in opponents’ Beto O’Rourke and Joaquin Castro’s home state.

According to the results, Biden heads the Lone Star State Democratic presidential field and is the only candidate to top President Trump when the president is isolated against each competitive Democrat (Biden over Trump: 48-44 percent).

Arguably, Texas, with its 38 Electoral Votes and the largest cache that a Republican candidate can generally claim, is Trump’s most important state. Losing here would likely mean forfeiting the presidency. There is no mathematical way to compensate for Trump failing to win Texas’ electoral votes and still allow him a path to reach the 270 Electoral Votes to claim a national victory.

In the Democratic primary, scheduled for Super Tuesday, March 3, Biden leads the pack of candidates with 30 percent of the vote, topping ex-Rep. O’Rourke (16 percent), Sen. Bernie Sanders (15 percent), Sen. Elizabeth Warren (11 percent), and the nine others who recorded between one and four percent statewide support.

Sens. Amy Klobuchar (D-MN), Kirsten Gillibrand (D-NY), Michael Bennet (D-CO), Govs. Jay Inslee (D-WA) and Steve Bullock (D-MT), Reps. Tulsi Gabbard (D-HI), Eric Swalwell (D-CA), Seth Moulton (D-MA), and Mayors Bill de Blasio (New York, NY), Wayne Messam (Miramar, FL), failed to reach the one percent plateau.

But, how would such a vote split translate into delegates for the participating candidates? Under Democratic Party rules, each state has both at-large and district delegates. Another group, called PLEO’s, are comprised of state and local Democratic Party leaders along with elected officials.

Continue reading

The Early Primary Cycle

By Jim Ellis

June 6, 2019 — Looking at the 2020 primary calendar, it is obvious that the presidential race is already having an impact upon what is becoming an accelerated congressional campaign schedule in many states.

The analysts for the Daily Kos Elections website released their research posting all of the 2020 state primary dates giving us a better indication of which congressional primaries will be held earlier than their traditional scheduled primary slot.

Several states that have moved to early presidential primary dates have also transferred their entire ballot, meaning the congressional cycle will start earlier than usual for many members and challengers.

Texas and Illinois are typically the first states to hold primary elections, and they are again at the forefront of the congressional calendar. Texas will hold its presidential and congressional nominating elections on March 3, which will become the 2020 Super Tuesday. Illinois, along with Florida and Arizona, will vote on March 17. But, on that date, only Illinois will hold congressional nomination elections.

Next year, however, several other states, will join Texas with a full ballot primary on March 3.

Continue reading

Trump’s Ballot Politics

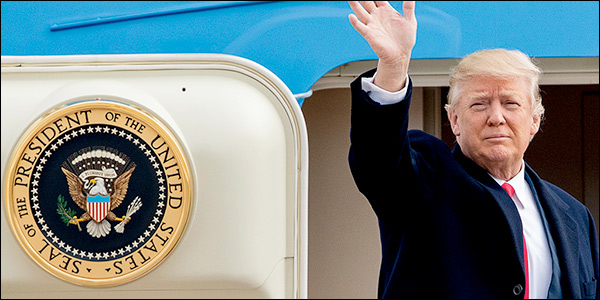
President Donald Trump | whitehouse.gov


By Jim Ellis

May 28, 2019 — Earlier this month, the California state Senate approved a bill that would require presidential candidates to release their tax returns in order to qualify for the Golden State ballot. A similar measure was vetoed by then-Gov. Jerry Brown (D) in 2017, but current Gov. Gavin Newsom (D) is expected to sign the measure.

A total of 17 other states also have similar pending legislation, with the strongest chances for enactment coming most probably in New York and Washington.

The move, of course, is targeted at President Trump who will not release his tax returns. But, would denying him ballot placement in states that he won’t carry actually hurt him?

A contrary argument exists to suggest that Trump and the down-ballot Republican candidates in those states might actually receive some tangential benefits from the president not being on the official ballot in places like California and New York, in particular.

First, if Trump didn’t appear on the California, New York, and Washington ballots, it would not change the Electoral College outcome because he won’t carry any of those states. He will likely concede them at the outset and spend no campaign money in any of those locations. Therefore, his ballot placement in these places could arguably be irrelevant.

Continue reading

The 2020 Democratic Nomination
Will Look Much Different From 2016

By Jim Ellis

May 24, 2019 — As the Democratic presidential field swells to 24 candidates — with the first Democratic presidential forum on tap for late June in Miami, and the first votes being cast in Iowa now just over eight full months away — it’s a good time to review how different this presidential nomination contest will be from the 2016 version.

To review, Hillary Clinton won 34 primaries and caucuses in 2016 as compared to 23 for Sen. Bernie Sanders (I-VT). There are 57 sanctioned delegate voting entities in the Democratic nomination universe. The 57 are comprised of the 50 states, the District of Columbia and the five territories, and a Democrats Abroad category that combines all US citizens living in foreign countries who will still have voting privileges in US elections.

Clinton won 55.2 percent of the 2016 national Democratic popular vote versus Sen. Sanders’ 43.1 percent when combining the totals from all the primaries and caucuses. Though the Sanders Campaign called foul over the Super Delegate voting inflating Clinton’s delegate total, and actually turning six states’ first-ballot roll call from Sanders to Clinton and sending one more state into a tie, Clinton still carried the pledged, or elected delegate, count 2,205 to 1,846, translating to a 54.4 percent margin. When adding the Super Delegate and uncommitted delegate votes, she captured 58.3 percent of the convention total.

Continue reading

Weekly Political Synopsis,
Period Ending May 17, 2019

By Jim Ellis

PRESIDENT
• Gov. Steve Bullock: As has been expected for some time, Montana Gov. Steve Bullock (D) officially announced his presidential effort this week, becoming the 23rd Democratic candidate. Bullock made the argument that he will be an effective national candidate because he’s won two elections in a conservative state and has been able to earn legislative achievements, like Medicaid expansion, in negotiating with Republican leaders.

• Mayor Bill de Blasio: Following Gov. Bullock, New York City Mayor Bill de Blasio released an announcement video at the end of the week making him the 24th Democratic presidential candidate for the 2020 election cycle. His declaration centered around being the candidate for “working families,” and cited the $15 minimum wage, a free pre-K school program, a comprehensive healthcare program that especially covers mental health, and paid sick leave.

• Florida: Former Vice President Joe Biden continues to see strong polling numbers, with the latest data coming from Florida. The Tel Opinion Research organization is reporting its latest results (released May 8; 800 likely Florida Democratic primary voters) that show Biden pulling away from his Democratic opponents on an open-ended ballot test poll. An open-ended ballot test is one where the respondent is not given the candidates’ names. That approach tests for committed strength.
According to Tel Opinion, Biden leads Sen. Bernie Sanders (I-VT), 39-16 percent, with Sens. Elizabeth Warren (D-MA) and Kamala Harris (D-CA) each pulling only five percent support. South Bend (IN) Mayor Pete Buttigieg follows at three percent preference. All of the candidates scored well on the favorability index scale. Biden is viewed positively with an 81:13 percent ratio, where Sen. Sanders’ score is 68:23 percent.

SENATE
• Arizona: Phoenix-based pollster OH Predictive Insights released their latest data from their May 1-2 poll (600 likely Arizona voters) where they queried the respondent universe about the impending Senate race between appointed Sen. Martha McSally (R) and retired astronaut Mark Kelly (D). Though we are more than a year before Arizona’s 2020 late August primary, the chances are strong that the aforementioned will be their respective party standard bearers.
According to the OH poll results, the early race again earns toss-up status. The sample breaks 45-44 percent in Sen. McSally’s favor, which is virtually identical with the firm’s late February poll giving the incumbent a 46-44 percent edge.

Continue reading