Tag Archives: Quinnipiac University

Cuomo Poll: Retirement Seen As
Preferential Over Resignation

By Jim Ellis

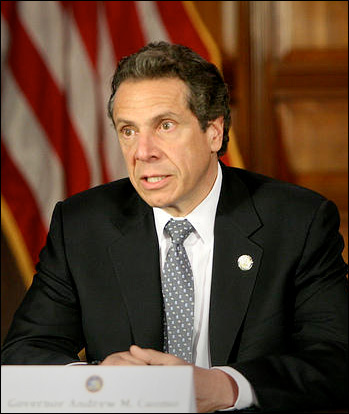
New York Gov. Andrew Cuomo (D)

March 8, 2021 — A new Quinnipiac University poll of the New York electorate (March 2-3; 935 self-identified NY registered voters, live interview) was released late last week after his press conference with mixed results for embattled Gov. Andrew Cuomo (D).

While his numbers are consistently bad with Republicans and Independents, the governor remains strong with his dominant Democratic base. Thus, while a majority of the Q-Poll respondents don’t favor the governor resigning, a large number believes he should not seek re-election in 2022.

To begin, the governor’s favorability ratio is 45:46 percent favorable to unfavorable, which is not particularly bad considering the negative effects of his dual-scandal situation, one involving COVID-related nursing home deaths and the other sexual harassment claims from former staff members.

The positive rating, however, is almost exclusively from Democrats. By a margin of 65:27 percent, self-identified Democrats still view the governor’s job performance positively. Republicans are wholly opposed, 13:82 percent positive to negative, and Cuomo is also decidedly upside-down with Independents, 33:57 percent.

Surprisingly, the polling sample still gives him positive reviews for his handling of the Coronavirus situation (56:41 percent), but, again, most of the favorable ratings come from Democrats, 80:18 percent, while Republicans and Independents both hold strongly negative opinions about how the governor has managed COVID-19: 17:80 percent among tested Republicans; 42:54 percent among Independents.

Once a small number of Democratic officials opened the spigot of dissent toward the governor, many more joined to form a high-flowing chorus. The calls for Cuomo’s resignation aren’t having much effect, however, as a majority, 55:40 percent, do not favor the governor giving up his office before his term ends. As mentioned above, however, the same polling sample does believe he should not seek a fourth term next year, and on this question, even the Democratic response is close.

Overall, 59 percent of the respondents say he should retire at the end of this term, while 36 percent believe he should run again. The Republican pro-retirement ratio registers 90:9 percent. Virtually two-thirds of the Independents (66:28%) say he should retire at the end of next year, while Democrats still barely back him remaining in office after the next election, 50:44 percent.

Continue reading

Iowa: Questioning the Polls

By Jim Ellis

Oct. 19, 2020 — Every political observer remembers that the cumulative polling community incorrectly predicted the Great Lakes states of Michigan, Pennsylvania, and Wisconsin in the 2016 Trump-Clinton presidential race, but further research finds additional significant misses in succeeding elections.

Political research reveals that two of those campaigns came in Iowa during the 2016 presidential race and the hotly contested governor’s race two years later. Today, we look at the Hawkeye State numbers with the goal of potentially ascertaining if there is a common polling pattern or consistent error factor.

In October, four polls have been released for the 2020 contest from a like number of different pollsters, two from left of center organizations while the other two are independent entities. The research organizations are Data for Progress, Civiqs for the Daily Kos Elections webpage, YouGov, and Quinnipiac University. Each has conducted one October Iowa survey.

In the presidential race, the polls yield former vice president Joe Biden an average lead of just over one percentage point. The cumulative ballot test mode then finds Des Moines real estate executive Theresa Greenfield (D) topping Sen. Joni Ernst (R) with a margin of four percentage points.

How do these numbers compare to recent polling vs. results electoral history, and is there an inherent Republican under-poll present?

In 2016, the Real Clear Politics polling average from Nov. 1-4 found then-candidate Donald Trump leading former Secretary of State Hillary Clinton by a mean average of three percentage points derived from three polls and three different polling firms. On Election Day, Nov. 4, 2016, Trump carried the state by a much larger 9.5-point margin.

Overall, 26 Iowa polls were released during the 2016 election cycle, with Trump recording a cumulative average lead of under half of one percentage point. According to the Real Clear Politics polling archives, 12 firms combined to reach the grand total, including Public Policy Polling (5 surveys), NBC News/Wall Street Journal/Marist College (5), Loras College (3), Quinnipiac University (3), Emerson College (2), and Selzer & Company for the Des Moines Register (2). The widest spread came from Loras College (Clinton plus-14) at the end of June. The Selzer & Company for the Des Moines Register poll produced the most accurate finding, Trump plus-7, at the very end of the election cycle (Nov. 1-4, 2016).

Continue reading

Georgia Polling Dichotomy

By Jim Ellis

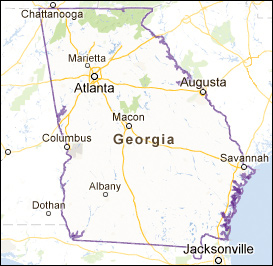
Oct. 16, 2020 — An October polling plethora has been released in Georgia, which is becoming one of the most important 2020 election cycle states both in terms of the presidential and US Senate outcomes. As the only state featuring two US Senate races, Georgia has attracted more than its share of polling universe attention.

Quinnipiac University released new data yesterday that either is detecting a new trend or is an outlier. Their results give Democratic presidential nominee Joe Biden, and US Senate candidates Jon Ossoff and Raphael Warnock big leads in their respective races, something no other survey research firm is reporting.

The Quinnipiac poll (Oct. 8-12; 1,040 likely Georgia voters, live interview) finds Biden posting a 51-44 percent lead over President Trump, Ossoff claiming a similar 51-45 percent advantage over Sen. David Perdue (R), and Rev. Warnock outpacing both Rep. Doug Collins (R-Gainesville) and appointed Sen. Kelly Loeffler (R) by 19 and 21 percentage points (41-22-20 percent).

Six other pollsters, also surveying in October, largely see things much differently.

Polling within the same period as Quinnipiac are Survey USA, Data for Progress, and Morning Consult.

Survey USA chose exactly the same sampling period as Quinnipiac, Oct. 8-12. With a sample size of 877 likely Georgia voters also in live interviews, they see a dissimilar political landscape. While they find Biden leading in the presidential race, his margin is only two points, 48-46 percent.

The two pollsters’ Senate numbers are starkly different. S-USA finds Sen. Perdue leading Ossoff, 46-43 percent, a net nine-point variance when directly compared with Quinnipiac. The jungle primary special election race is even more disparate. While Quinnipiac projects one of the biggest leads for Warnock during the entire election cycle, S-USA finds only a four-point difference between he and Sen. Loeffler, 30-26 percent, a far cry from the Q-Poll’s 41-20 percent.

The two pollsters even see a different ballot test order. While the Q-Poll finds a Warnock-Collins-Loeffler split, Survey USA projects a virtual three-way battle among Warnock, Loeffler, and Collins. The latter poll posts Rep. Collins’ statewide support at 20 percent.

Continue reading

Sen. Lindsey Graham’s Challenge

By Jim Ellis

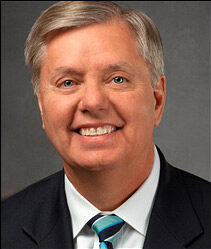
Is incumbent Sen. Lindsey Graham (R-SC) in re-election trouble?

Sept. 18, 2020 — Quinnipiac University surveyed the South Carolina political situation as part of their three-state polling series, which again produces some eyebrow-raising data. The results help identify why Sen. Lindsey Graham, a Republican senator from a Republican state, finds himself languishing in a competitive contest.

The poll (Sept. 10-14; 969 likely South Carolina voters, live interview conducted by the RDD firm for Quinnipiac) tested both the presidential and Senate campaigns. President Trump leads former vice president Joe Biden 51-45 percent in a ballot test that seems to be an under-count when looking at the survey’s supporting numbers. Sen. Graham, however, falls into a tie with opponent Jaime Harrison, at 48-48 percent, in a result that the underlying responses do seem to support.

President Trump’s six-point lead appears low because he tops Biden on virtually every personal and issue question. The Trump favorability index is 51:45 percent positive to negative, but the Biden ratio is much worse at 43:50 percent. The generic Republican-Democrat number falls 52-44 percent in favor of the GOP label.

Despite poor coronavirus management numbers for the president nationally, this South Carolina survey returns a 49:48 percent approval number on his handling of the issue. Furthermore, the respondents, in a 50-46 percent break, believe President Trump would do a better job handling coronavirus in the future than Biden. Not a particularly strong performance in this issue area, but better for the President than in almost any other place.

Trump also scores better in his handling of the economy (55-40 percent), the military (54-42 percent), and “keeping your family safe” (52-43 percent). Biden is favored, and only barely, 48-46 percent, on just one issue: racial equality.

Most importantly, the issue matrix sets up perfectly for Trump. The top two issues, according to these respondents, are the ones upon which the president is basing his campaign, law and order (23 percent) and bringing back the economy (22 percent). The Biden key issues rate rather poorly: coronavirus (12 percent), racial equality (12 percent), and healthcare (10 percent).

All of these underlying numbers suggest the Trump ballot test margin should be stronger than six points, which could be a signal that there is a “shy Trump voter factor” even in what is typically a safe Republican state. The “shy Trump voter” is the phrase now used to describe the individual who only secretly favors the president.

Continue reading

Senate Sleepers in Minnesota
and South Carolina

By Jim Ellis

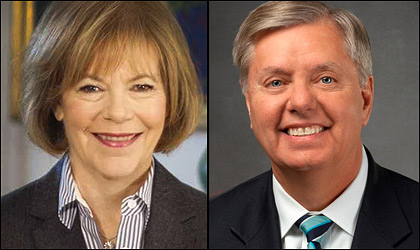
Are incumbents Sen. Tina Smith (D-MN), left, and Sen. Lindsey Graham (R-SC) in re-election trouble?

Sept. 8, 2020 — At the beginning of the 2020 election cycle, it appeared that Sens. Tina Smith (D-MN) and Lindsey Graham (R-SC) were set for re-election. That no longer appears to be the case.

Polling is now consistently showing close races in the two states, and Sen. Smith’s recent comments about the police have seemingly moved her re-election campaign closer to the toss-up category according to a just-released Harper Polling survey.

Looking at the HP data (Aug. 30-Sept. 1; 50 likely Minnesota voters via live interview), Sen. Smith’s ballot test edge has dropped to just 43-41 percent over former US Rep. Jason Lewis (R).

In May, Harper found Sen. Smith posting a 46-35 percent advantage over Lewis. After this release, Public Policy Polling forecast a 48-39 percent split toward the end of July. Lastly, Emerson College published what appears to be precursor data to the latest Harper findings. The Boston-based university poll (Aug. 8-10; 73 likely Minnesota voters) found a three-point split between the two contenders, 48-45 percent, again in Sen. Smith’s favor.

To the southeast of liberal Minnesota, in conservative South Carolina, veteran Sen. Lindsey Graham (R) has also fallen into a competitive contest with former state Democratic Party chairman Jaime Harrison, who had raised an incredible $29 million for his smaller state race through the end of June.

The most recent poll we have seen from the Palmetto State was released at the beginning of August. Quinnipiac University (July 30-Aug. 3; 91 registered South Carolina voters) detected a 44-44 percent tie between Sen. Graham and Harrison. From mid-July through the beginning of August, six surveys were conducted, including the Quinnipiac study, and Sen. Graham’s average lead was only 2.8 percentage points.

Continue reading

The Wild Polling Spectrum

By Jim Ellis

July 27, 2020 — We’ve seen a plethora of presidential state polls released in the past couple of days, and the results seem to swing wildly among the various pollsters. While most studies have shown former vice president Joe Biden at present winning most of the key states, his margins don’t seem particularly secure even while his national numbers appear stronger.

Let’s explore the polling divergence, and remember that sample selection, weighting, size of the respondent universe, and length of time to complete the survey process are all important variables in determining a ballot test result. Also, the huge number of people refusing to answer their phones or not participating in political surveys means that pollsters must further rely on weighting and mathematical supposition to compensate for the lack of live responses.

With that short background, let’s look at some of the key states producing the widest swings:


FLORIDA

• Quinnipiac University – July 16-20 (924 registered voters; live interview)

Biden 51
Trump 38
Biden plus 13

• St. Pete Polls – July 13-14 (3,018 likely voters via automated system)

Biden 50
Trump 44
Biden plus 6

Though Biden is up in both polls, the margin difference is stark. The Q-Poll, brandishing such a wide spread in what is typically a close political state raises reliability questions.


GEORGIA

• Garin Hart Yang Research – July 9-15 (800 likely voters)

Biden 47
Trump 43
Biden plus 4

• Spry Strategies – July 11-16 (701 likely voters; IVR)

Trump 49
Biden 46
Trump plus 3

Here we see two different leaders within two different polling samples within the same virtual period. Republicans tend to under-poll in the southern states, which could certainly be present in at least the GHY poll.


Continue reading

Polling At Odds

By Jim Ellis

April 24, 2020 — A series of surveys were conducted by several independent pollsters in the most critical states that will likely determine the outcome of the 2020 presidential campaign, and the results are somewhat conflicting.
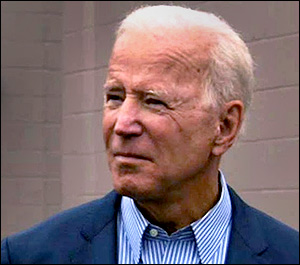
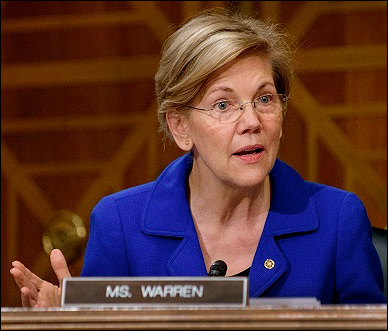
Largely consistent data comes in polls from three pollsters: Fox News, Ipsos, and Quinnipiac University. They surveyed the electorates in Florida (Quinnipiac), Michigan (Fox News and Ipsos), Pennsylvania (Fox News and Ipsos), and Wisconsin (Ipsos). All of the studies were conducted during the April 15-21 period. The pollsters did not collaborate, each directing their own surveys individually.

The results in all of these states found former vice president Joe Biden leading President Trump, obviously a strong positive sign for Biden since the candidate carrying the preponderance of these particular states will win the national election.

The Biden advantage in each poll ranges from three percentage points (Ipsos in Wisconsin) to eight (Fox News in both Pennsylvania and Michigan; Ipsos in Michigan).

Florida is one of the core states for President Trump, meaning that it’s one of the five most important places that he must carry to win the election. Here, Quinnipiac finds Biden leading the incumbent, 46-42 percent, which is more exaggerated than most current Sunshine State polls. We must also acknowledge that Republicans have been under-polling in Florida during recent elections by approximately two percentage points. If typical Florida political trends continue through this election, we will see a very close final tally.

The Great Lakes states covered in this Update are all in the swing category, and President Trump will have to at least carry one of them to claim a national victory. Conversely, if the President holds his five core states (Arizona, Florida, Georgia, North Carolina, and Texas), then Biden would likely be forced to carry all of the Great Lakes’ swings: Michigan, Pennsylvania, and Wisconsin.

Another research entity is also in the picture, however. Change Research, polling for CNBC (April 17-18; 5,787 likely voters in Arizona, Florida, Michigan, North Carolina, Pennsylvania, and Wisconsin) also tested the critical battleground states just after the other pollsters completed their questioning phase. The CNBC poll, as well, was an independent undertaking and not executed in conjunction with any other research firm.

Continue reading

A Polling Dichotomy for Joe Biden

Former Vice President and 2020 Presidential Candidate, Joe Biden (D)

By Jim Ellis

Oct. 28, 2019 — We covered a series of polls Friday that were projecting former Vice President Joe Biden regaining his early campaign advantage. On closer review, however, it was found that only the small sample polls with a large error factor were yielding the unusual Biden margins. The large sample surveys found a much closer split among the top three candidates: Biden and Sens. Elizabeth Warren (D-MA) and Bernie Sanders (I-VT).

Several new polls were just released during the latter half of the month, all conducted after Oct. 15 with large or statistically acceptable sample sizes, yet the conclusions drawn nationally and in key states were very different.

The following table compares the analyzed polls, which are national, and two each from California and Iowa. Both of the states have unique positions in the Democratic nomination process. Iowa is the first voting state, and thus a trendsetter, while California has the largest contingent of delegates, 416 on the first ballot and 495 when the Super Delegates are added to the total.

The new Quinnipiac University survey released last Thursday (Oct. 17-21; 1,587 US registered voters; 713 likely Democratic primary voters) finds Sen. Warren capturing the national lead, with Biden and Sen. Sanders following. Mayor Pete Buttigieg breaks into double digits in a country-wide poll for the first time since early June.

National Polls Biden Warren Sanders Buttigieg Harris
Q-Poll 21 28 15 10 5
Morning Consult 30 21 18 6 6
Survey USA 32 22 17 5 7


Iowa Polls Biden Warren Sanders Buttigieg Harris
Civiqs 12 28 18 20 3
Suffolk 18 17 9 13 3


California Biden Warren Sanders Buttigieg Harris
Change Research 19 28 24 9 8
Survey USA 33 18 17 4 8

This result, however, directly conflicts with both the Morning Consult track (Oct. 16-20; 11,521 likely Democratic primary voters; online US) and Survey USA’s most recent national poll (Oct. 15-16; 1,071 US likely Democratic primary voters), both of which report consistent result spreads and a Biden edge.

Inconsistencies are also present in Iowa and California. The new Civiqs/Iowa State University poll (Oct. 18-22; 598 likely Iowa Democratic primary voters) returns the worst numbers for Biden of any poll either nationally or in a state.

Continue reading

Behind the Polls: Is Warren Really Up?

Democratic presidential candidate, Sen. Elizabeth Warren

By Jim Ellis

Oct. 10, 2019 — The publication, Market Watch, carried a story that the Drudge Report included on their daily national site yesterday indicating that Sen. Elizabeth Warren (D-MA) had topped former Vice President Joe Biden in four of five most recent national polls, but they didn’t cover the entire polling picture. (Market Watch story: A new front-runner for the 2020 Democrats? Warren edges Biden in average of polls)

The MW story cited Warren leading Biden in the Quinnipiac University survey (Oct. 4-7; 646 registered US voters), the Investors Business Daily/TIPP Poll (Sept. 26-Oct. 3; 341 registered US voters), The Economist/YouGov study (Sept. 28-Oct. 1; 602 likely US Democratic primary voters), and the Monmouth University (Sept. 23-29; 434 registered US voters) survey. Her aggregate edge fell between one and four percentage points, yet neither candidate broke 30 percent in any of the polls.

“With Biden facing questions over the Ukraine and China because of the Trump impeachment inquiry, and Sen. Sanders now experiencing health problems, Sen. Warren could soon be establishing herself as the clear front-runner and person to beat …”

The only other highlighted survey came from Politico/Morning Consult (Sept. 30-Oct. 6; 16,529 likely US Democratic primary voters) that actually found the former vice president continuing to lead by his typical 12-point margin, 33-21 percent, with Sen. Bernie Sanders (I-VT) recording 19 percent support.

The story’s premise is that these polls suggest that Sen. Warren has already caught Biden and that she may well be the new national Democratic leader. There are several reasons why this might not be the correct conclusion, however.

Continue reading

California Tightening

By Jim Ellis

July 19, 2019 — Two new surveys of the California Democratic electorate show the presidential race tightening in the state that possesses the largest delegation to the Democratic National Convention: 416 first-ballot delegates. To highlight the state’s size within the convention universe and its importance to the nomination process, the next largest state, Texas, has 228 first-ballot delegates.

The latest Quinnipiac University poll (July 10-15; 1,125 registered California voters, 519 likely Democratic primary voters) finds home-state Sen. Kamala Harris (D-CA) leading the pack of candidates with 23 percent of the vote. In second place is former Vice President Joe Biden who has 21 percent with Sen. Bernie Sanders (I-VT) posting 18 percent support. Following is Sen. Elizabeth Warren (D-MA) who recorded 16 percent. South Bend Mayor Pete Buttigieg falls all the way to three percent just ahead of New York City businessman Andrew Yang who registered two percent preference.

The Capitol Weekly survey (July 1-15; 816 likely California Democratic primary voters), with a larger polling sample, arrives at similar results. According to the CW data, Sen. Warren has the lead with 25 percent, just ahead of Sen. Harris and Biden who both command 20 percent, while Sen. Sanders posts a close 16 percent. In this poll, Mayor Buttigieg does much better, eight percent, but is nowhere close to qualifying for delegates at the 15 percent minimum threshold.

While these polls are different in candidate order, they both suggest that the top four candidates are currently running close and each would qualify for a substantial share of the large first-ballot delegate contingent.

Available polling data can be used to provide a rough extrapolation model of the early delegate count, examining the latest surveys in the first five voting states to provide at least some measure about how close this race might become if the support patterns we see today continue into the early voting period.

The delegate apportionment process comes in two distinct categories: the at-large delegates who are tied to the statewide vote, and those coming from each congressional district, which range from four to seven delegate votes apiece in California, for example. The latter delegates are apportioned by the individual congressional district popular vote, with those candidates who receive at least 15 percent of the vote in the particular CD qualifying for the district delegate apportionment.

Continue reading