Tag Archives: North Carolina

The Final Outlook

2018-elections-open-seatsBy Jim Ellis

Nov. 6, 2018 — Election Day has arrived, but it is likely that a majority of those planning to vote have already done so. Early voting totals are way up in most of the 37 states that employ a pre-election ballot casting procedure in comparison to the 2014 midterm election.

According to the University of Florida’s United States Elections Project, 25 of the 37 states report receiving more early votes than they did four years ago. None, however, is larger than Texas where early voting has already exceeded that grand total votes cast in 2014. The same also has occurred in Nevada, but it’s less surprising since the last midterm aggregate turnout there was unusually low.

In Texas, just under 4.9 million votes already have been received. In 2014, the aggregate early and Election Day vote was 4.72 million. In 2014, 44 percent of the total vote was cast early. If this same pattern occurs, the current election total turnout will exceed the 2016 presidential level participation figure of 8.96 million votes, however it is unlikely that will happen. How the increased turnout will affect the election outcome is undetermined at this point, but the high number of first-time voters suggest that Democrats could improve their typical standing.

Continue reading

National Early Voting Report

By Jim Ellis

i-vote-i-countOct. 31, 2018 — Now more than halfway through the early voting period in the 37 states that offer early voting options for the populace, some places are turning in record participation rates. Each state has various nuances in their early voting procedures, so comparing the early reports to each other is of little value. Going back to contrast the current 2018 reported numbers with how that particular state voted in the last midterm election (2014) does have significance, however.

Already, in the latest available reports according to the United States Election Project administered by the personnel at the University of Florida, seven states are reporting more received early voting ballots than were recorded for the entire 2014 pre-election period. They are:

• Tennessee – 162.3% more ballots (1,029,846 versus 634,364 recorded in 2014)
• Texas – 144.3% increase (2,980,915 versus 2,066,368 recorded in 2014)
• Indiana – 127.9% increase (292,726 versus 228,932 recorded in 2014)
• Nevada – 122.5% increase (372,455 versus 304,005 recorded in 2014)
• Georgia – 111.1% increase (1,188,636 versus 1,069,912 recorded in 2014)
• Minnesota – 106.0% increase (249,909 versus 235,808 recorded in 2014)
• Delaware – 103.2% more ballots (8,550 versus 8,288 recorded in 2014)


An additional seven states have so far recorded better than 85 percent of their early voting total in comparison to their entire 2014 pre-election voting universe:

• North Carolina – 97.1% of previous (1,140,657 versus 1,174,188 recorded in 2014)
• Virginia – 94.2% of previous total (191,755 versus 203,556 recorded in 2014)
Continue reading

Forecasting the Results – Part II

By Jim Ellis

2018-democrat-house-majority-breakdown-text-graphicOct. 8, 2018 — The Democrats need to convert a net 24 seats to secure a one-seat majority in the US House on Election Day, Nov. 6. Many reports quote the number 23 as what is necessary to win control, but the new Pennsylvania map will yield one seat coming back to the Republicans — the new open 14th District — thus pushing the total up to 24.

As stated Friday, our forecasts listed below are based upon a series of factors, including current polling numbers, voter history, candidate personal and job approval favorability, fundraising, other races on the state ballot that could drive turnout, and outside issues such as the confirmation vote to for Judge Brett Kavanaugh to become a Supreme Court Justice, which could change the turnout model, etc.

According to our new analysis, the Democrats are on the cusp of converting the requisite number of Republican seats to take a bare majority and seeing their caucus become significantly larger. At this point, the Democratic gain range appears to reach 23 on the low side and 35 at the apex.

Looking at the country by state and region, it appears the Democrats will do well in the Midwest, in particular. The Great Lakes region that delivered President Trump his surprise victory appears to be snapping back to the Democrats in the midterm House races. Michigan looks particularly good for them at both the statewide and district levels.

Continue reading

Gerrymandering Ruling in North Carolina Could Alter Majority

North Carolina Congressional Districts

North Carolina Congressional Districts


By Jim Ellis

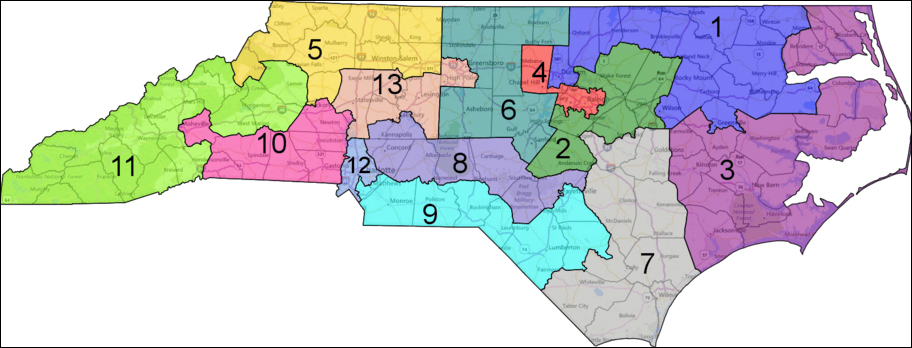
Sept. 3, 2018 — Last week, the same three-judge panel that previously ruled the North Carolina congressional boundaries as unconstitutional did so again, well after the lines were re-drawn in 2016 to reflect one of their previous decisions.

Predictably, the two Democratic judges ruled to overturn the legislature’s map once again, with the lone Republican dissenting. This time, the ruling concerns political gerrymandering, after the panel originally tossed the map because of what they cited as “racial gerrymandering.” The North Carolina delegation has split 10R-3D since the original 2011 map was created after the 2010 census.

The latest action, coming at a time when the US Supreme Court has only eight members because Judge Brett Kavanaugh has not yet been confirmed to replace retired Justice Anthony Kennedy, could stand if the high court fails to halt or invalidate the ruling.

If the decision remains, it becomes very unclear as to how the election would proceed. If the lines are suddenly unconstitutional, a new map would have to be set in its place. At this point, it is probable that the court would usurp the state legislature’s constitutional power and force its own map into law.

What happens to the candidates who won the May primaries, or even lost, as in the case of Rep. Bob Pittenger (R-Charlotte), remains in flux. It is likely many lawsuits would be filed, likely from candidates who won primaries but were denied the chance of running in the subsequent general election, to voters who would be disenfranchised after voting for a candidate who, after being nominated, no longer appears on the ballot because the particular voter has been arbitrarily shifted to another district, and every argument in between.

Continue reading

Maine’s Instant Run-Off Examined

By Jim Ellis

MAINEJune 15, 2018 — An interesting situation is developing from the still-in-progress Maine primary that could become a test case for either changing or instituting state run-off electoral systems.

As you know, run-offs ensure that a party nominee obtains a majority or, in the case of North Carolina and South Dakota, a substantial share of the vote. The run-off’s purpose is to prevent a party from nominating a winner in a multi-candidate election who garners only a small plurality.

The South Carolina 4th Congressional District race is a good example of why some states choose a run-off format. On Tuesday, both parties advanced a pair of candidates into respective run-off elections because no one came close to receiving majority support.

For the Republicans, with 13 candidates running to succeed retiring Rep. Trey Gowdy (R-Spartanburg), former state Sen. Lee Bright finished first, but with only 25 percent of the vote. In most other states, he would have been nominated. Since, 75 percent of the Republican voters chose another candidate, the run-off ensues. On June 26, Bright and state Sen. William Timmons (R-Greenville), who finished second with 19.2 percent, will decide the party nomination in one-on-one electoral competition. On the Democratic side, candidates Doris Lee Turner (29.4 percent) and Brandon Brown (28.5 percent) advance, while Eric Graben (25.7 percent), Will Morin (9.1 percent), and J.T. Davis (7.2 percent) are eliminated.

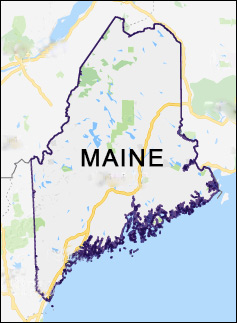
Maine is testing a unique new system that prevents situations such as their own that occurred in the past two gubernatorial elections, but avoids the cost of holding another separate election. Political observers will now see if their new idea will work and potentially withstand a legal challenge.

Continue reading

The Primaries Through May:
Setting November, Part I

By Jim Ellis
the-primaries
May 24, 2018
— We have now completed primaries in 13 states. Therefore, we can review the key run-off and general election pairings that these primaries produced. Today we’ll look at Arkansas, Georgia, Idaho, Illinois, Indiana, Kentucky, Nebraska and North Carolina. Tomorrow we’ll go over the states of Ohio, Oregon, Pennsylvania, Texas and West Virginia.


Arkansas: Gov. Asa Hutchinson (R) is a lock for re-election. Rep. French Hill (R-Little Rock) is a clear favorite over state Rep. Clarke Tucker (D-Little Rock).


Georgia: Republicans will see a gubernatorial July 24 run-off between Lt. Gov. Casey Cagle and Secretary of State Brian Kemp. The winner faces former state House Minority Leader Stacey Abrams (D) in the open general election. In the House, Democrats are forced into run-offs in District 6 and 7. The winners will be clear underdogs to Reps. Karen Handel (R-Roswell) and Rob Woodall (R-Lawrenceville).


Idaho: Lt. Gov. Brad Little (R) is a heavy favorite over state Rep. Paulette Jordan (D-Moscow) in the open governor’s race. Former state Sen. Russ Fulcher (R) will succeed Rep. Raul Labrador (R-Eagle/Boise) in the open 1st District.


Continue reading

The Turnout Report:
Signs of a “Blue Wave”?

By Jim Ellis

May 10, 2018
— Looking at the voting patterns for Tuesday’s primaries in the four states holding elections, we see little evidence of the reported “blue wave” often discussed in media analyst reports — meaning a surge in Democratic Party voter turnout — but there is also sparse information to determine specific participation trends in many of the noted places.

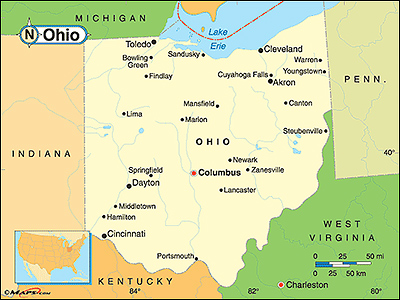
state-of-ohio-mapOhio has the most complete data to compare totals for midterm elections dating back to 2006. On Tuesday, 1,506,777 people voted in the two major party primary elections, with just about 55 percent recorded in the Republican gubernatorial contest. The current grand total was the second largest participation figure in the four midterms since 2006, inclusive. The 1.506 million aggregate total was second only to the 2006 turnout that saw 1.626 million Ohioans voting. This year, both parties featured open gubernatorial primaries, each with a clear leader heading into Election Day.

In all four of the tested Ohio midterms, more people voted in the Republican primary. The 54.9 percent participation factor when measuring the two parties against each other on Tuesday night was the second highest of the sampled four. Only the Republicans’ 56.0 percent participation rate in 2014 was stronger. To put the current rate in perspective, the GOP low occurred in 2006 when 50.8 percent of primary voters cast a Republican ballot. In the succeeding general election, Democrat Ted Strickland would win the governor’s campaign, making the result consistent with the higher Democratic primary participation rate.

In the Buckeye State House races, eight of the 16 districts featured primary elections for both parties. In each of the districts holding primaries for both parties, the political entity controlling the seat before the election saw more people vote in that party’s primary. The most significant race was the special primary election in the 12th District, the seat former Rep. Pat Tiberi (R) vacated to return to the private sector. There, 23,902 more people voted in the Republican primary, thus providing some tangible support for predicting the state Sen. Troy Balderson (R-Zanesville) is favored to win the seat in the Aug. 7 special general vote.

Continue reading