Category Archives: Reapportionment

Michigan’s Lost Seat

Michigan Congressional Districts

By Jim Ellis

Aug. 31, 2021 — Losing a congressional seat is nothing new to the Michigan delegation. Since the 1980 census, inclusive, the state has lost a district in every reapportionment and two in the 1990 iteration. Today, we continue our series about the states gaining and losing congressional districts under 2020 national reapportionment with a look at the Wolverine State.

Michigan is difficult to draw not only because of the consistent seat losses, but so many of the state’s districts abut immovable objects: i.e., an international or state border, or a body of water. Under the current map, 10 of Michigan’s 14 congressional districts at least partially border a country, state, or lake.

The Michigan per district population number for the 2020 census is a high 775,179 individuals. High per district resident numbers often occur when a state loses a seat. In this case, all of Michigan’s 14 districts must gain population, hence the underlying reason for another delegation reduction.

Another factor in making the state a rather unique draw for the new Michigan Independent Citizens Redistricting Commission that is tasked with creating the new congressional map for the initial time, is the areas needing to gain the most population lie in opposite ends of the state. This, added to the fact that over 70 percent of the current districts border an immovable object, means the 2021 redistricting process is a significant challenge for the eleven commissioners (4R; 3D; 4N) with no previous experience in drawing political maps.

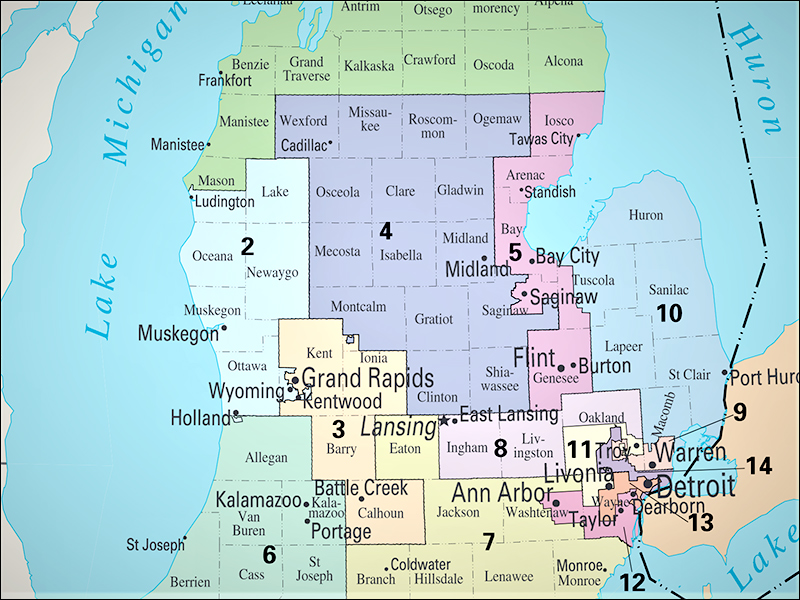
The area with the largest population shortfall comes in the northern part of the state. Rep. Dale Kildee’s (D-Flushing/Flint) 5th District is the seat furthest away from the population quota, down 104,476 individuals. Directly to his west, Rep. John Moolenaar’s (R-Midland) 4th District is 77,325 people under quota, and to the north all the way to the Canadian border, Rep. Jack Bergman’s (R-Watersmeet) Upper Peninsula 1st District will require an additional 70,829 residents. Combined, these three seats are 252,630 people short of the population quota for three congressional districts.

The area in the second-most need of population is the city of Detroit. The two districts that encompass the city, Districts 13 (Rep. Rashida Tlaib-D) and 14 (Rep. Brenda Lawrence-D) are a combined 184,290 people short for a pair of districts. Because both CDs 13 and 14 and majority minority seats, it is more than probable that the commission won’t collapse these districts because of Voting Rights Act requirements.

Continue reading

The Lost California Seat

Los Angeles, California-area Congressional Districts


By Jim Ellis

Aug. 24, 2021 — Continuing our series about the states losing seats in reapportionment and which members might be on the outside looking in, today we analyze the Golden State of California. The largest US House delegation will downsize one seat, meaning it will send 52 members to the next Congress.

To put the California population change into historical perspective, during the 1980 census the state gained seven new US House seats. In the 2010 census, for the first time in history, California did not add, and now we see actual reduction.

For the second time, the California Citizens Redistricting Commission will draw the congressional map and under specific criteria. The districts are supposed to be constructed on a nonpartisan basis without regard to specific incumbents’ residences or political situation, adhere to the Voting Rights Act pertaining to their substantial number of majority minority districts, and keep cities and counties whole where possible.

Looking at the actual census population by district as opposed to the previously published census estimates, changes in which districts may be on the chopping block are evident. Under the estimates, it appeared that Rep. Adam Schiff (D-Burbank) was the low population CD, but his 28th District seat now is 12th from the bottom. The new low is veteran Rep. Lucille Roybal-Allard (D-Los Angeles), whose 40th District needs to gain 70,139 people.

Of the current 53 districts, 35 must gain population while 18 will shed; hence, the reason the state is losing a seat. From a county perspective, it appears the Los Angeles members will be most at risk. A total of 18 congressional districts encompass LA County including nine that are wholly-contained. The other nine districts cross county borders into such places as Kern, Orange, San Bernardino, and Ventura.

Of the 18 districts wholly or partially within the LA County borders, Democrats represent 15 and Republicans just three. Only one of these 18, the 23rd District of House Republican Leader Kevin McCarthy (R-Bakersfield), must shed population. Though certain other places in the state are also resident-low, there is a good possibility that the seat reduction will come from one of the Los Angeles districts, particularly among the nine seats wholly within the county since all of those contiguous seats must gain residents.

Continue reading

North Carolina – A Different Take

North Carolina’s 12 Congressional Districts

    By Jim Ellis

    Aug. 19, 2021 — Based upon the 2019 census estimates, it appeared that the new North Carolina congressional seat was bound for the Charlotte area, but the actual 2020 census figures released late last week may be suggesting a different location.

    In looking at the current 13 congressional districts, all but Rep. G.K. Butterfield’s (D-Wilson) 1st District must shed population, hence the reason North Carolina was awarded a new seat. While the census estimates found Rep. Alma Adams’ (D-Charlotte) 12th District being the state’s most over-populated CD, the actual census data finds another district moving beyond the resident number that the Adams’ seat must shed (159,818) in order to reach the state’s target population figure of 745,671 individuals.

    The new data find that freshman Rep. Deborah Ross’ (D-Raleigh) 2nd District is the state’s largest, housing 165,703 people over the state’s new per CD quota. Additionally, neighboring Rep. David Price (D-Chapel Hill), whose 4th District also contains part of Raleigh’s Wake County, also must shed a large number (129,692).

    Looking at the neighboring districts in the Charlotte area, the 8th and 9th CDs of Reps. Richard Hudson (R-Concord) and Dan Bishop (R-Charlotte), along with one county from Rep. Virginia Foxx’s (R-Banner Elk) western 5th District, means that the Charlotte area’s population surplus is approximately 250,000, while the Raleigh districts are over-populated by a slightly larger approximate figure of 300,000 people.

    In the east, the Butterfield district is short just 6,238 people and neighboring Rep. Greg Murphy’s (R-Greenville) 3rd District must shed 10,979 individuals, meaning a relatively simple swap between these two seats and a sliver from a third, most likely Rep. David Rouzer’s (R-Wilmington) 7th District, will easily bring these seats into balance.

    The western sector is also relatively well defined. Freshman Rep. Madison Cawthorn’s (R-Hendersonville) 11th District sits in the Tar Heel State’s far western corner. It needs to shed 22,890 people, but can only go one way, east, because this district is bordered on three sides by South Carolina, Georgia, and Tennessee. Therefore, Reps. Cawthorn, Foxx, and Patrick McHenry’s (R-Lake Norman) 10th CD all shedding relatively small population segments to the east should also be a relatively easy population balancing exercise.

    This suggests the new seat could be placed in the region between Raleigh and Charlotte, meaning those existing districts that lie between the two metropolitan areas – those of Hudson, Bishop, and Rep. Ted Budd’s (R-Advance) open 13th District, in addition to the severely over-populated seats of Reps. Adams, Ross, and Price – will likely see the greatest change.

    This brings us to the Republican-controlled state legislature and how they might draw the new congressional map. In North Carolina, the governor has no veto power over redistricting, so Democratic Gov. Roy Cooper will not be a factor in how the congressional and NC House and Senate maps are constructed. Republicans gained four seats in the state House in 2020 bringing their majority to 69-51. In the state Senate, Democrats added a net one seat thus lessening the GOP majority to 28-22. Therefore, the Republican leadership is in the driver’s seat.

    Continue reading

Census by District

By Jim Ellis

Aug. 17, 2021 — We can now see exactly where each congressional district in the country stands in terms of population. The Census Bureau delivered the state redistricting data last week, and the Daily Kos Elections site data team segmented the numbers into individual congressional districts.

Below is a chart of the 38 states that have more than two districts, isolating the CDs that are the most over and under populated. The “High” column depicts the district that is the most over-populated in the state, while the “Low” is the one requiring the most new residents. The “+/-” column shows how many districts in the particular state are over and under populated.

The most robust district is that of Texas freshman Rep. Troy Nehls (R-Richmond). His southwest Houston seat houses just under one million people, at an exact count of 972,309. The least populated seat is West Virginia’s 3rd District (Rep. Carol Miller-R): 326,267 people under quota. With all of the Mountain State seats seriously down, it is clear as to why West Virginia lost a seat in reapportionment.

There are only two states, Colorado and Oregon, where all of the current districts are over-populated. Both entities gain one seat in reapportionment. On the other end of the spectrum, Michigan and Pennsylvania saw all districts falling below their new population quota, and in Illinois, 17 of their current 18 do as well. All three states are losing a district.

It is not surprising that California lost a seat for the first time in history. A total of 35 of their current 53 seats require more population versus 18 that must shed residents. New York barely lost a seat, by just 89 people statewide, which is surprising when seeing 23 of their current 27 districts requiring additional population.

The states are now converting their new data into their redistricting software systems. After that, most will hold hearings for public input prior to district construction beginning.

STATE DIST INCUMBENT HIGH LOW +/-
Alabama 5 Mo Brooks (R) 43,348 4, 3
7 Terri Swell (D) -53,143
Arizona 5 Andy Biggs (R) 86,414 3, 6
2 Ann Kirkpatrick (D) -50,133
Arkansas 3 Steve Womack (R) 86,266 2, 2
4 Bruce Westerman (R) -66,283
California 45 Katie Porter (D) 53,645 18, 35
-1 40 Lucille Roybal-Allard (D) -70,139
Colorado 4 Ken Buck (R) 148,823 7, 0
+1 3 Lauren Boebert (R) 36,543
Connecticut 4 Jim Himes (D) 25,627 2, 3
2 Joe Courtney (D) -21,288
Florida 9 Darren Soto (D) 186,381 21, 6
+1 13 Charlie Crist (D) -41,756
Georgia 7 Carolyn Bourdeaux (D) 94,304 8, 6
2 Sanford Bishop (D) -92,108
Illinois 7 Danny Davis (D) 10,986 1, 17
-1 17 Cheri Bustos (D) -79,907
Indiana 5 Victoria Spartz (R) 50,921 5, 4
8 Larry Bucshon (R) -38,579
Iowa 3 Cindy Axne (D) 61,382 1, 3
4 Randy Feenstra (R) -31,730
Kansas 3 Sharice Davids (D) 57,816 1, 3
1 Tracey Mann (R) -33,697
Kentucky 6 Andy Barr (R) 33,300 4, 2
5 Hal Rogers (R) -57,592
Louisiana 6 Garret Graves (R) 40,173 3, 3
4 Mike Johnson (R) -47,947
Maryland 4 Anthony Brown (D) 26,772 6, 2
7 Kweisi Mfume (D) -68,401
Massachusetts 7 Ayanna Pressley (D) 18,714 4, 5
1 Richard Neal (D) -50,635
Michigan 11 Haley Stevens (D) -17,368 0, 14
-1 5 Dan Kildee (D) -104,476
Minnesota 3 Dean Phillips (D) 24,586 5, 3
7 Michelle Fischbach (D) -39,978
Mississippi 4 Steven Palazzo (R) 37,196 3, 1
2 Bennie Thompson (D) -65,829
Missouri 3 Blaine Luetkemeyer (R) 35,121 6, 2
1 Cori Bush (D) -54,618
Nebraska 2 Don Bacon (R) 47,170 2, 1
3 Adrian Smith (R) -53,152
Nevada 3 Susie Lee (D) 79,374 2, 2
1 Dina Titus (D) -73,332
New Jerseyy 8 Albio Sires (D) 47,314 5, 7
2 Jeff Van Drew (R) -41,606
New Mexico 2 Yvette Harrell (R) 8,181 2, 1
1 Melanie Stansbury (D) -11,264
New York 12 Carolyn Maloney (D) 34,717 4, 23
-1 23 Tom Reed (R) -83,462
North Carolina 2 Deborah Ross (D) 165,703 12, 1
+1 1 G.K. Butterfield (D) -6,238
Ohio 3 Joyce Beatty (D) 23,119 2, 14
-1 6 Bill Johnson (R) -99,512
Oklahoma 1 Kevin Hern (R) 36,806 3, 2
2 Markwayne Mullin (R) -69,793
Oregon 1 Suzanne Bonamici (D) 157,843 5, 0
+1 4 Peter DeFazio (D) 117,399
Pennsylvania 10 Scott Perry (R) -5,379 0, 18
-1 15 Glenn Thompson (R) -90,540
South Carolina 1 Nancy Mace (R) 87,689 3, 4
6 Jim Clyburn (D) -84,741
Tennessee 4 Scott DesJarlais (R) 62,976 5, 4
9 Steve Cohen (D) -77,122
Texas 22 Troy Nehls (R) 205,322 28, 8
+2 13 Ronny Jackson (R) -59,517
Utah 4 Burgess Owens (R) 65,265 1, 3
3 John Curtis (R) -31,190
Virginia 10 Jennifer Wexton (D) 100,750 6, 5
9 Morgan Griffith (R) -87,917
Washington 7 Pramila Jayapal (D) 28,862 6, 4
6 Derek Kilmer (D) -33,730
West Virginia 2 Alex Mooney (R) -275,777 0, 3
-1 3 Carol Miller (R) -326,627
Wisconsin 2 Mark Pocan (D) 52,678 2, 6
4 Gwen Moore (D) -41,320

Re-Mapping Ohio

Ohio’s Congressional Districts


By Jim Ellis

July 21, 2021 — Thanks to the state of Ohio, the redistricting calendar has new life. The Buckeye State’s lawsuit against the Census Bureau and a negotiated out of court settlement led to an agreement that all 50 states will receive their redistricting census tract data on or around Aug. 15 instead of well into October or beyond.

Typically, states receive their individual data, mandatory for drawing federal congressional districts that must be drawn to a factor of plus or minus one person, during the early part of the year. The Census Bureau largely blames this year’s delays on COVID-19, though a great deal of the problem centers around the bureaucracy attempting to impose differential privacy on part of the data, meaning some of the key statistical information would not be released. The states not having full access would lead to the new districts being less statistically reliable.

Even the August data distribution agreement, however, creates a tenuous situation for the states to complete their redistricting work and still adhere to mandatory internal local deadlines. This is particularly true for the states like Ohio that are losing or gaining congressional representation.

Ohio grew at a percentage rate of just 2.3 through the decade, ranking 44th in the nation and just over a full percentage point below the national average. The 2020 census numbers add to the continuing trend for this state of failing to keep pace with national population growth. In the 1980 census, for example, Ohio held 21 congressional districts. It would lose two congressional seats in the 1990 apportionment, one more in 2000, and two more in 2010 to bring us to its current total of 16. The 2020 census reduces the delegation to 15 seats.

Currently, the Ohio US House delegation stands at a party division of 12R-4D. Since the count is so lopsided in the Republicans’ favor, it looks on paper that the GOP would be the party that loses one of its members.

Looking closely at the individual district population data, however, that may not be the case. Despite the Dems having only four seats, three of their four are among Ohio’s most under-populated CDs, while one, the 3rd District of Rep. Joyce Beatty (D-Columbus), actually must shed the most population, some 34,000-plus residents according to the latest published figures (July 2019). Adding the last year of population statistics could change the situation, but at first glance the statewide and district totals suggest alterations will only be minor.
Continue reading

The Michigan Wild Card

Michigan Congressional Districts


By Jim Ellis

July 16, 2021 — For the third consecutive census, the Wolverine State of Michigan loses a congressional seat but this time it is more difficult to determine how the new map will be drawn and which of the state’s 14 US House members, comprised of seven Democrats and seven Republicans, will be the odd member out.

The big change is that for the first time a citizens’ commission, and not the state legislature, will draw the map. The 13-member commission has been conducting briefings to organizations around the state since April 3 and has public input meetings scheduled with those that began July 8 through Aug. 26.

What places Michigan in a wild card situation, however, won’t become clear until the US Census Bureau sends the state its individual tract data that will arrive on or around Aug. 15. At that point, the key question will be answered as to just how many people the city of Detroit has lost. This will be the critical factor in determining how the new congressional map is constructed.

Like every state, Michigan is bordered on all sides meaning the members with districts on the edge are typically in better defined position than those residing in the geographic middle. In this state’s case, the Great Lakes surround the split land masses on the north, east, and west, with Canada lying to its north and east, and Indiana and Ohio to the south.

Looking at the available public population data that only is current through July 1 of 2019, all current 14 districts must gain residents, hence the state losing a CD, with three most significantly holding the fewest people. Those three are the two Detroit seats, Districts 13 (Rep. Rashida Tlaib-D) and 14 (Rep. Brenda Lawrence-D), and the Flint-anchored seat, District 5 (Rep. Dan Kildee-D). All three are likely to need an influx of more than 100,000 people apiece.

Continue reading

House Vulnerables – Part II

By Jim Ellis

July 13, 2021 — On Monday, we began a two-part series on what are arguably the most vulnerable dozen US House seats based upon the individual district’s political performance over the past two elections.

Below is the priority order update covering the second half of the top 12 most vulnerable CDs. As you will continue to see below, all of the seats except one are Republican held.

To refresh, the first six covered were:

• IA-2 (Rep. Mariannette Miller-Meeks, R-Ottumwa)
• IA-1 (Rep. Ashley Hinson, R-Marion/Cedar Rapids)
• IA-3 (Rep. Cindy Axne, D-Des Moines)
• FL-27 (Rep. Maria Elvira Salazar, R-Miami)
• CA-48 (Rep. Michelle Steel, R-Orange County)
• NY-22 (Rep. Cynthia Tenney, R-New Hartford)

Here’s our look at the next six:

UT-4: Rep. Burgess Owens (R-Salt Lake City) – Ave R vote: 48.8%
• Former NFL football star and businessman Burgess Owens defeated freshman Rep. Ben McAdams (D) by one percentage point in 2020, and we can expect another competitive race here again within this mostly suburban Salt Lake City congressional district located in the metropolitan area’s southern sector.

Republicans, who are in full control of the Utah redistricting process, will attempt to improve the district for Owens, which is possible since the 4th CD is the fastest growing district in the fastest growing state over the past decade. The best estimates suggest that the 4th District must shed approximately 50,000 people to other CDs. This should allow map drawers to subtract a substantial number of Democratic voters from the district, thus yielding Burgess a slightly more favorable political domain.

At this point, McAdams, who was the Salt Lake County mayor prior to his election to Congress, has not indicated whether he will return for a re-match.

MN-1: Rep. Jim Hagedorn (R-Rochester) – Ave R vote: 49.3%
• Two-term Rep. Hagedorn just announced that his cancer has returned, meaning an immediate treatment regimen. How this will affect his re-election campaign is yet to be determined. Hagedorn has won two close elections, as has his Democratic colleague in the adjacent district, Rep. Angie Craig (D-Eagan).

Minnesota is the only state in the nation that sees a split control legislature, meaning each party controls one house. Since the state did not lose a congressional district in apportionment as originally projected, it would not be surprising to see a legislative deal made where Democrats and Republicans are flipped between the two adjoining districts. The changes would result in Hagedorn gaining Republicans and Craig adding Democrats. Redistricting will perhaps be the most critical factor in determining the outcome of both districts come 2022 and beyond.

Continue reading

House Vulnerables – Part I

By Jim Ellis

July 12, 2021 — Much of the early 2022 election cycle narrative places the Republicans in an advantageous position to re-claim the US House majority they lost in 2018, but there are mitigating factors that make predicting such an outcome premature.

To begin, analysts cite the historical voting pattern that yields large midterm losses for the party that wins the White House in the previous election – a mean average House seat loss of 25 for the president’s party in the first midterm in the 11 such elections from Eisenhower in 1954 to Trump in 2018 – which is a key influence factor for the 2022 election cycle.

Since we are immediately following a new census, redistricting will change at least to a small degree all of the districts in the 44 states that will have more than one seat. Most analysts believe Republicans will be at least slight beneficiaries of the new maps because their party controls most of the state legislatures that will draw the new lines.

The states, however, do not yet even have their census tract data and won’t until mid-August at the earliest; therefore, redistricting will be later and even more chaotic than we are accustomed to seeing. The delays could lead to more interim court maps being placed for the 2022 election, which could neutralize any gain the GOP achieves from their favorable position in the majority of state legislatures that have redistricting power.

Additionally, one must look at the 2020 race results to determine which of the seats will become major targets. In November, 53 current House members won their elections with less than 52 percent of the vote, 27 Democrats and 26 Republicans. In terms of the closest election results, and likely meaning the most vulnerable conversion targets for the 2022 re-election cycle, we see 11 Republicans in the 12 seats where the incumbent’s party averaged 50 percent of the vote or below in the previous two electoral contests.

This tells us that the national Republican strength factor heading into the midterm vote may be somewhat weaker than noted in a cursory overview.

Continue reading

California’s Lost Seat

By Jim Ellis

July 7, 2021 — For the first time in history, California loses a congressional seat in reapportionment, and the public input session that was scheduled to begin yesterday continues the California Citizens Redistricting Commission’s Phase 2 process. This week, the commission members continue listening to testimony about how the districts should be drawn for the state’s congressional delegation and both houses of the Golden State’s legislature.

Sitting adjacent to each other are the following California congressional seats: CA-32 (Rep. Grace Napolitano; D-Norwalk), CA-38 (Rep. Linda Sanchez; D-Whittier), CA-40 (Rep. Lucille Roybal-Allard; D-Downey), and CA-44 (Rep. Nanette Diaz-Barragan; D-San Pedro).

After California, along with the other 49 states, receives its census tract information after the Aug. 15 negotiated deadline, the five Democrats, five Republicans, and four non-affiliated CCRC members will study and organize the data until their Phase 3 line drawing process commences in September. The commission was created through a 2010 ballot proposition that removed redistricting power from the legislature and instituted a citizens panel to create the new post-census maps every 10 years. This is the body’s second redistricting cycle.

The commission timeline was crafted after the state of Ohio sued the Census Bureau to force a faster distribution of the state redistricting data. Originally, using COVID as their principal excuse, the Bureau leadership set Oct. 1 as their distribution deadline goal. In typical years, states would have received the census tract information months ago. The Ohio lawsuit was settled with the two sides agreeing on an Aug. 15 deadline that is now in effect for the whole country.

The commission members are now tasked with changing the state’s 53-member congressional delegation into a map that features only 52 seats. And now, the question of just which area will lose the district must be tackled.

Looking at the latest public district data, that through July 1, 2019, we see some patterns providing key clues. It is understood that the last year of the census is not included in these numbers, and reports suggest that the final 12 months of the 10-year cycle resulted in significant change for the state as the number of people leaving for other places substantially increased. In fact, for the first time, California actually has fewer people than it did in a preceding year.

The most significant loss appears to come in central Los Angeles County. Looking at the current 53 districts, the seat with the lowest population is Rep. Adam’s Schiff’s (D-Burbank) San Fernando Valley 28th CD. But the cluster of seats in the heart of Los Angeles suggests an area where two seats can easily be collapsed.

Continue reading

Oregon’s New Seat

Current Oregon US Congressional Districts Map


By Jim Ellis

July 2, 2021 — Oregon earned a sixth congressional seat in the 2021 apportionment, but exactly where that district will be placed on the Beaver State’s new map is not particularly obvious.

Like most states, Oregon handles redistricting through the legislative process and Democrats have firm control of all three legs of the legislative stool. In addition to Gov. Kate Brown (D), the party has a 18-11 margin in the state Senate with one Independent. Their majority in the state House of Representatives is similarly large, 37-22, with one vacancy. Yet, the partisan breakdown of the state might make drawing a solid 5D-1R map surprisingly somewhat difficult.

Currently, the five congressional districts are not obviously gerrymandered, as the seats are drawn in block form. Naturally, all but two cluster around the Portland metropolitan area, the state’s dominant population region.

The five incumbents are all senior, with Rep. Suzanne Bonamici (D-Washington County) being the most junior with her original election coming in a special 2012 contest. The delegation dean is House Transportation & Infrastructure Committee chairman Peter DeFazio (D-Springfield) who was first elected in 1986.

As you can see from the following chart, using 2019 population numbers since the Census Bureau will not be delivering census tract data to the states until after Aug. 15, the five districts are remarkably equivalent in relation to population size.

DISTRICT INCUMBENT 2020% POPULATION REG. VOTERS
1 BONAMICI 64.6% 858,875 570,186
2 BENTZ 59.9% 841,022 598,375
3 BLUMENAUER 73.0% 853,116 588,614
4 DeFAZIO 51.5% 820,504 588,508
5 SCHRADER 51.9% 844,220 578,609

The population figures suggest that each district will have to shed between 115,000 to 155,000 people in order to create six CDs with equal population, likely a number around 710,000 individuals for this state.

Continue reading