Tag Archives: COVID-19

NJ Governor’s Race In Upset Range

Click on above image from TV ad to go to New Jersey gubernatorial Republican candidate Jack Ciattarelli’s ad about state taxes and opponent incumbent Gov. Phil Murphy (D).

By Jim Ellis

Oct. 26, 2021 — The most recent Emerson College poll for the New Jersey governor’s race (Oct. 15-18; 600 likely New Jersey voters; combination live interview, text, and interactive voice response system) suggests that Republican challenger Jack Ciattarelli, a former state assemblyman and ex-county official, has an outside chance of scoring an upset victory over Gov. Phil Murphy (D) in next week’s statewide election.

While the odds still favor a Murphy win, the new survey certainly shows areas of weakness for the Democratic incumbent and a path to victory for the Republican challenger. According to Emerson, Gov. Murphy leads 50-44 percent, and when leaners are added to the mix, the margin tightens to an even closer 52-48 percent.

Among those who classify themselves as “very likely” voters, the Murphy lead shrinks well within the polling margin of error at 48-45 percent. The biggest Ciattarelli positive sectors are among undecided voters, who are breaking his way on a 59-41 percent clip, the Independent segment, 56-32 percent, men, 50-41 percent, and those in the 50-64 age range, 49-46 percent.

Gov. Murphy obviously can highlight positive sectors of his own. The most favorable sign pointing to a Murphy victory next Tuesday is among the people who say they have already voted. Of those, 76 percent indicated they supported Gov. Murphy as opposed to just 24 percent who cast their ballot for Ciattarelli.

The Emerson poll finds the governor leading among women, 57-40 percent, those aged 18-29, at 58-42 percent, the 30-49 aged sector, 47-41 percent, and the oldest and most reliable voting segment, the people aged 65 and older, 53-42 percent.

Neither candidate has a particular advantage on the favorability index. Gov. Murphy records a 49:47 percent favorable to unfavorable rating, while Ciattarelli posts an even 40:40 percent ratio.

Continue reading

New Tight Nevada Polling

By Jim Ellis

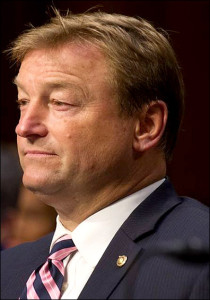
Former Sen. Dean Heller (R-NV)

Oct. 6, 2021 — The Nevada Independent online news site commissioned a September Mellman Group statewide poll (Sept. 15-22; 600 likely Nevada voters, live interview) just as former US Sen. Dean Heller (R) was announcing that he will join the Republican field vying to challenge Gov. Steve Sisolak (D). The results and analysis were released Monday.

The pollsters also tested the US Senate race between first-term Democratic incumbent Sen. Catherine Cortez Masto and former Attorney General Adam Laxalt (R). Both the gubernatorial and the US Senate contest returned close general election projections.

Nevada has featured close elections in the previous decade leading up to the 2022 voting cycle. Of the 18 statewide electoral contests between and including 2012 and 2020, Democrats have averaged 49.0 percent of the vote and Republicans’ 45.2 percent. In eight of the 18 campaigns, the winner recorded only plurality support.

During the time span, Democrats won 10 statewide races and Republicans won eight, but the GOP has scored only one victory since 2016. Therefore, it is not surprising to again see close polling data, and we can expect similar results throughout the campaign cycle.

According to the Mellman data, Gov. Sisolak would lead ex-Sen. Heller, 46-43 percent, but the small margin tightens even further if Clark County Sheriff Joe Lombardo were to win the Republican nomination. In the Sisolak-Lombardo pairing, the governor edges the sheriff by half a percentage point, 44.9 – 44.4 percent.

In the Republican primary, asked of only those who said they plan to vote in that contest though the sample number was not released, Heller led Sheriff Lombardo, 31-23 percent, with former professional boxer Joey Gilbert and North Las Vegas Mayor John Lee trailing with 11 and three percent, respectively.

On the positive side for Gov. Sisolak, his favorability index is only slightly upside-down at 46:48 percent, despite his handling of the COVID-19 virus getting a heavy 38:59 percent negative rating. He leads in all-important Clark County by 10 and seven points against Heller and Lombardo, respectively.

The governor saw a negative reading coming from Washoe County (Reno), however, which tends to act as a bellwether of the Nevada vote and an entity that Sisolak carried in 2018 against then-Attorney General Laxalt. The Mellman poll posted Heller to an eight-point lead over Sisolak in Washoe, while Sheriff Lombardo enjoyed a six-point edge.

Continue reading

Re-Mapping Ohio

Ohio’s Congressional Districts


By Jim Ellis

July 21, 2021 — Thanks to the state of Ohio, the redistricting calendar has new life. The Buckeye State’s lawsuit against the Census Bureau and a negotiated out of court settlement led to an agreement that all 50 states will receive their redistricting census tract data on or around Aug. 15 instead of well into October or beyond.

Typically, states receive their individual data, mandatory for drawing federal congressional districts that must be drawn to a factor of plus or minus one person, during the early part of the year. The Census Bureau largely blames this year’s delays on COVID-19, though a great deal of the problem centers around the bureaucracy attempting to impose differential privacy on part of the data, meaning some of the key statistical information would not be released. The states not having full access would lead to the new districts being less statistically reliable.

Even the August data distribution agreement, however, creates a tenuous situation for the states to complete their redistricting work and still adhere to mandatory internal local deadlines. This is particularly true for the states like Ohio that are losing or gaining congressional representation.

Ohio grew at a percentage rate of just 2.3 through the decade, ranking 44th in the nation and just over a full percentage point below the national average. The 2020 census numbers add to the continuing trend for this state of failing to keep pace with national population growth. In the 1980 census, for example, Ohio held 21 congressional districts. It would lose two congressional seats in the 1990 apportionment, one more in 2000, and two more in 2010 to bring us to its current total of 16. The 2020 census reduces the delegation to 15 seats.

Currently, the Ohio US House delegation stands at a party division of 12R-4D. Since the count is so lopsided in the Republicans’ favor, it looks on paper that the GOP would be the party that loses one of its members.

Looking closely at the individual district population data, however, that may not be the case. Despite the Dems having only four seats, three of their four are among Ohio’s most under-populated CDs, while one, the 3rd District of Rep. Joyce Beatty (D-Columbus), actually must shed the most population, some 34,000-plus residents according to the latest published figures (July 2019). Adding the last year of population statistics could change the situation, but at first glance the statewide and district totals suggest alterations will only be minor.
Continue reading

Cuomo Poll: Retirement Seen As
Preferential Over Resignation

By Jim Ellis

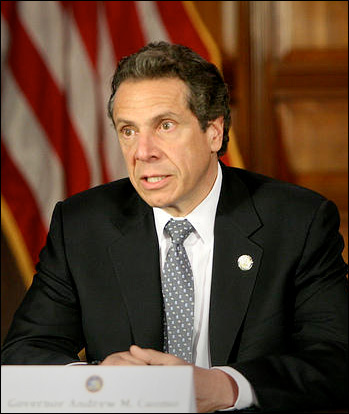
New York Gov. Andrew Cuomo (D)

March 8, 2021 — A new Quinnipiac University poll of the New York electorate (March 2-3; 935 self-identified NY registered voters, live interview) was released late last week after his press conference with mixed results for embattled Gov. Andrew Cuomo (D).

While his numbers are consistently bad with Republicans and Independents, the governor remains strong with his dominant Democratic base. Thus, while a majority of the Q-Poll respondents don’t favor the governor resigning, a large number believes he should not seek re-election in 2022.

To begin, the governor’s favorability ratio is 45:46 percent favorable to unfavorable, which is not particularly bad considering the negative effects of his dual-scandal situation, one involving COVID-related nursing home deaths and the other sexual harassment claims from former staff members.

The positive rating, however, is almost exclusively from Democrats. By a margin of 65:27 percent, self-identified Democrats still view the governor’s job performance positively. Republicans are wholly opposed, 13:82 percent positive to negative, and Cuomo is also decidedly upside-down with Independents, 33:57 percent.

Surprisingly, the polling sample still gives him positive reviews for his handling of the Coronavirus situation (56:41 percent), but, again, most of the favorable ratings come from Democrats, 80:18 percent, while Republicans and Independents both hold strongly negative opinions about how the governor has managed COVID-19: 17:80 percent among tested Republicans; 42:54 percent among Independents.

Once a small number of Democratic officials opened the spigot of dissent toward the governor, many more joined to form a high-flowing chorus. The calls for Cuomo’s resignation aren’t having much effect, however, as a majority, 55:40 percent, do not favor the governor giving up his office before his term ends. As mentioned above, however, the same polling sample does believe he should not seek a fourth term next year, and on this question, even the Democratic response is close.

Overall, 59 percent of the respondents say he should retire at the end of this term, while 36 percent believe he should run again. The Republican pro-retirement ratio registers 90:9 percent. Virtually two-thirds of the Independents (66:28%) say he should retire at the end of next year, while Democrats still barely back him remaining in office after the next election, 50:44 percent.

Continue reading

Newsom Recall Election Likely

By Jim Ellis

California Gov. Gavin Newsom (D)

Feb. 15, 2021 — Proponents of the recall effort against California Gov. Gavin Newsom (D), with more than a month remaining until the March 17 deadline to collect the necessary number of valid signatures, are already close to forcing a removal election.

Five other attempts have been made to recall Gov. Newsom, but this is the first that had a serious prospect of qualifying. According to the latest poll of the state’s electorate, dissatisfaction with both the governor and the state government’s response to the COVID-19 pandemic has led to the uprising.

Under California election law, state officials can be forced to stand for a recall election if a number of registered voters equal to 12 percent of the total number of votes cast in the most recent governor’s election, in this case the 2018 contest, sign a state certified petition. The total number of qualified signatures needed for the 2021 recall must equal a minimum of 1,495,709. Yesterday, the proponents reported that they have collected 1.47 million signatures. To ensure qualification, the organizing committee members have a goal of obtaining over 1.8 million signatures.

CALIFORNIA GOV. NEWSOME RECALL EFFORT:

 • Signatures Needed • Signatures Collected
 1,495,709 1,470,000
 • Signatures Reviewed • Signatures Validated
 485,650 410,087
 • Signature Approval Rate • Total Signatures Needed
 84.4% 1,772,169

At this point, the Secretary of State’s staff has reviewed 485,650 of the submitted signatures according to the FiveThirtyEight statistical website, and 410,087 have been ruled valid. This translates into an approval rate of 84.4 percent. If this ratio were to continue, the proponents would have to submit a minimum of 1,772,169 signatures. At their most recent reported gathering rate of over 100,000 signatures per week, they should easily reach their quota.

The University of California at Berkeley’s Institute of Government Studies released their latest statewide survey (Jan. 23-29; 10,357 registered voters from online stratified random samples) and compared it with the results from their September 2020 poll. The results show a significant deterioration in the governor’s support base in the short period between the two research studies.

Continue reading

The Alaska Challenge

By Jim Ellis

Alaska senate candidates: first-term Republican incumbent Dan Sullivan (left) and physician and commercial fisherman, Democrat Al Gross.

Oct. 8, 2020 — In the Last Frontier, the Democratic Party’s preferred candidate is stressing his independence and joined a legal fight to ensure that he would only be labeled as an Independent on the ballot. Still, the national party leadership is excited over physician and commercial fisherman Al Gross and his improving prospects in the Alaska Senate race against first-term Republican incumbent Dan Sullivan.

As the national Senate situation continues to change (i.e., North Carolina’s Cal Cunningham (D) becoming embroiled in a scandal, Sen. Susan Collins’ (R) numbers improving in Maine, Alabama Democratic Sen. Doug Jones badly trailing GOP challenger Tommy Tuberville, and trends favoring Republican wins in Kansas, Kentucky, and Texas) seeing late potential in a place like Alaska is a boon to the Democratic leadership’s goal of flipping Senate control to their side of the political aisle.

The party’s candidates remain in strong position to flip Arizona and Colorado and are competitive in South Carolina and the two Georgia seats, in addition to being favored to hold their competitive incumbents in Michigan and Minnesota. Therefore, control of the Senate could boil down to just one seat, so the emergence of the Alaska race is of national political importance.

Running with his “Always Alaska” message that includes moving beyond oil and gas and into renewable energy sources even though the former industry is one of the major employers in the state, Democrat Dr. Gross is moving close to Sen. Sullivan in polling and has plenty of money to compete.

At this point, the latest survey from the Harstad Strategic Research firm (for the Gross campaign; Sept. 20-23; 602 likely Alaska voters, live interview) finds Dr. Gross pulling within one percentage point of Sen. Sullivan, 46-45 percent. This margin is not far from the 2014 victory spread Sullivan recorded (48-46 percent) when unseating then-Sen. Mark Begich (D).
Continue reading

Debate Constituencies

By Jim Ellis

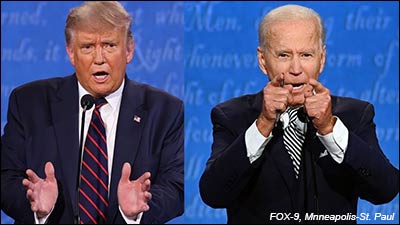
The candidates in action at the first presidential debate in Cleveland, Ohio: President Donald Trump (left) and former vice president Joe Biden.

Oct. 1, 2020 — In watching the first presidential debate the other night, the question that was hanging out there was, what was each candidate attempting to achieve in relation to the constituencies he needs to win the national election, and was each successful in achieving their specific goals?

The campaign is breaking down into two distinct issue areas for each man. President Trump wants to concentrate on rebuilding the economy and safety from the unrest in many metropolitan areas, while former vice president Joe Biden is zeroing in on healthcare, most specifically protecting the Affordable Care Act, often referred to as Obamacare, and attacking Trump over his COVID-19 record.

President Trump is attempting to rebuild his winning coalition in the battleground states that concentrated on 2016 economic issues. He did that in last night’s debate by highlighting his administration’s economic record pre-COVID and outlining how he would re-build the national economy moving forward after the related shutdown.

On law enforcement and public safety, an issue area emphasized in an attempt to re-connect with many suburban female voters who have left his coalition since the last election, Trump attacked hard. The president probably scored his strongest points of the night regarding this issue area as he pinned Biden down about the lack of law enforcement groups supporting the Democratic nominee’s candidacy.

Biden was strong in his defense of the Affordable Care Act, and again exposed the weakness in the Republican issue platform because the GOP doesn’t have an alternative plan to what currently exists. The Biden emphasis was also an attempt to target the higher educated suburban voter, and particularly the white, married female.

Additionally, the healthcare line of attack was also geared toward the base Democratic voter who depends on the ACA as their sole provider. Again illustrating that these individuals would lose their healthcare coverage if the Supreme Court were to declare the program as unconstitutional very likely scored political points for Biden within his targeted constituency groups.

In the closing section of the debate, President Trump used his time on the issue of mail voting to express his concerns about ballot security and the length of the post-election period that we will see in many states. Expecting political overtime to last “weeks, if not months,” Trump reiterated that concerns exist about whether we will have a verified election, while citing the many states that experienced problems during the primary season.

Continue reading