Category Archives: Governor

Newsom Wins Recall; Other Elections

By Jim Ellis

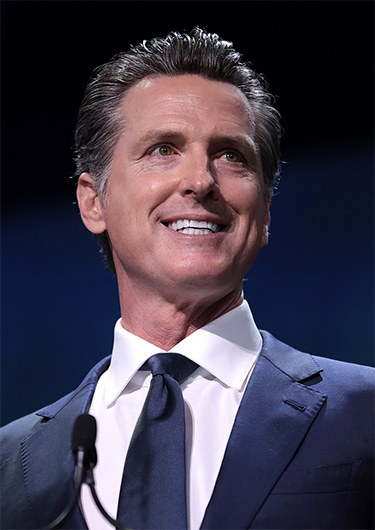
California Gov. Gavin Newsom (D)

Sept. 16, 2021 — California Gov. Gavin Newsom (D) easily avoided being recalled in last night’s statewide election, but the margin will likely close once all of the ballots are received and finally counted. The reported results are largely from mail ballots received well before election day. The posted turnout totals exceed 9 million voters, and this number will continue to grow.

The NO option on the recall ballot, meaning the vote individuals cast in order to keep Gov. Newsom in office, is running just under 64 percent, but under the California system of ballot signature verification it will be several weeks before we see official final totals. California also allows a long post-election period for ballots postmarked on election day to be received. It is clear, however, that Newsom will survive in office by a wide margin, but with an end-result closer margin than we see in early returns.

Though the replacement election became moot with the recall being rejected, conservative commentator Larry Elder was the clear leader, recording a tick under 47 percent of the vote. The next closest candidate was Democrat Kevin Paffrath with 10 percent. Former San Diego Mayor Kevin Faulconer (R) finished third with just under 9 percent. John Cox (R), who was one of the leading recall effort funders and the finalist against Newsom in the 2018 election, fell back to less than 4.5% of the vote. Media star Caitlin Jenner (R), who proved not to be a serious candidate, scored just 1.1% in the replacement election.

All of the replacement candidates were at a disadvantage in terms of financial resources. Though Elder raised a reported $18 million, an impressive amount in a short time frame, Gov. Newsom spent possibly as much as $80 million.

The rules for Newsom, however, were different. Because he was the recall subject, and the people were deciding the question as to whether or not he alone should remain in office, the campaign financial structure for him was that of a referendum. Therefore, he could raise unlimited amounts of money from individuals and entities. The replacement candidates, because they were running in an election campaign, were bound by the state campaign finance laws that feature contribution amount limits.
Continue reading →

Ohio Data: Below the Surface

By Jim Ellis

Sept. 10, 2021 — The London-based Redfield & Wilton Strategies international survey research firm tested electorates in several American states at the end of August, and today we look at their Ohio results. With a major open Senate campaign and a Republican governor seeking re-election in 2022, the Buckeye State is once again a national political focal point for the coming political year.

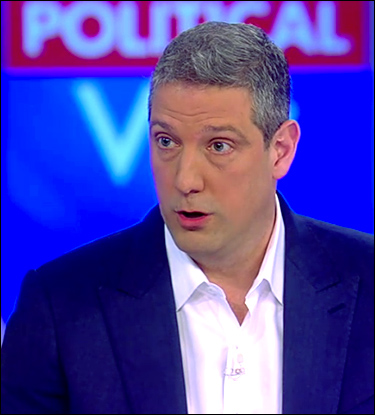
Ohio Rep. Tim Ryan announces his candidacy for the 2020 Presidential Election on the TV talk show, “The View.”

The Redfield & Wilton poll (Aug. 20-24; 1,200 likely Ohio voters) finds the Republican Senate candidates performing adequately opposite US Rep. Tim Ryan (D-Warren/Youngstown), who, at this early stage, has become the Democrats’ consensus statewide Senate contender.

Former state treasurer and 2012 US Senate candidate Josh Mandel (R) holds a 51-47 percent ballot test lead over Rep. Ryan within the sample segment who are self-identified as likely 2022 general election voters. Author J.D. Vance (R) largely falls into a dead heat with Ryan, trailing 37-36 percent, as does former Ohio Republican Party chair Jane Timken who places within two points of the congressman, 38-36 percent.

In the governor’s race, incumbent Republican Mike DeWine, who former Rep. Jim Renacci is challenging in the GOP primary from the ideological right, looks to be in strong shape against potential Democratic opponents. If Dayton Mayor Nan Whaley were the Democratic gubernatorial nominee, Gov. DeWine would post a 46-27 percent advantage. Should Cincinnati Mayor John Cranley become the Democratic nominee, he would trail the governor by a slightly larger 47-25 percent spread.

Generally, the Ohio polling pattern leans Democratic in the early going and then closes in the Republican candidates’ favor, while consistently understating GOP strength.

In the 2020 presidential election, Ohio polls in July of the election year were returning Joe Biden leads of 4-8 percentage points before former President Trump would rebound to score a mean average 1.0 percent polling lead close to election day, and then win the state going away with an eight-point margin, 53-45 percent. In 2016, the pattern was similar. In the July-September period, Hillary Clinton held leads of between 4 and 7 percentage points only to see the average favor Trump by a 2.2 percent spread. He would win the state 51-43 percent.

The same pattern occurred for Sen. Rob Portman (R) in 2016 and was present to a degree against Sen. Sherrod Brown (D) in 2018. In June through September of that year, certain polls found former Gov. Ted Strickland (D) leading incumbent Portman with a 3-6 point edge. As the race closed, Sen. Portman established an average 18-point lead and won 58-37 percent.

Even in a Democratic victory, the polling trend favoring Democrats early and then closing for the GOP toward election day was again present. During June-September of 2018, Sen. Brown held leads between 13-17 points. Going into the election, his polling average had slipped to 11 points, and he only won with a 6.4 percent margin.

Keeping this pattern in mind and then looking at the underlying Biden job approval numbers in the R&W poll suggests that even today, the GOP candidates are poised for a stronger finish than the current results yield. Overall, the Redfield & Wilton figures point to a 40:46 percent favorable to unfavorable presidential approval ratio for Biden, which isn’t particularly bad particularly in a state that the subject did not win. The underlying numbers, however, point to a much greater negative.

Continue reading →

A New Jersey Shock Poll

By Jim Ellis

New Jersey Gov. Phil Murphy (D)

Sept. 7, 2021 — The Fabrizio Lee polling firm, surveying for the Club for Growth organization (Aug. 4-29; 600 likely 2021 New Jersey election voters, live interview) finds New Jersey Gov. Phil Murphy (D) potentially falling into a precarious political position.

Since June 1, Gov. Murphy has led in all four publicly released polls, each from a different pollster, with margins ranging from a low of 11 to as high as 28 points over former state Assemblyman Jack Ciattarelli (R). The Fabrizio-Lee data casts a much different light upon the race, finding Gov. Murphy leading by a scant 43-41 percent margin as the contest has apparently become tighter with August ending.

Digging deeper into the polling analysis, it appears that Gov. Murphy is in slightly better position than the Fabrizio lead ballot test suggests, but nowhere close to his previous standing. The question then posed: is there significant movement toward Ciattarelli or is this Fabrizio Lee poll an outlier?

Among the 600 respondents who identify themselves as planning to vote in the Nov. 2 election, segmentation exists between those who have previously voted in an odd-numbered year election and those who have not. Among the “Gov-election” voters, Murphy’s ballot test position improves to 46-40 percent. For those who have not cast a ballot in a previous NJ governor’s election, Ciattarelli pulls ahead of the incumbent by a 41-35 percent margin, but these individuals are significantly less likely to participate.

The poll illuminates several other warning signs for the incumbent, however. While Ciattarelli has an 87:3 percent loyalty factor among Republicans, Gov. Murphy is running slightly less robustly among Democrats (75:11 percent). More concerning for the governor is him trailing among white voters (39-48 percent), and Independents (28-43 percent). Failing to improve within these two latter sectors could result in an upset election loss for the first term state chief executive.

Though the poll responses are weighted to compensate, the sampling universe’s racial composition is different than the state population numbers. The respondent sample is more heavily white than the state as a whole, with Hispanic and black respondents totaling only about half of their standing within the population at large. This would suggest that the Murphy ballot test numbers are slightly deflated.

Continue reading →

Perdue’s Georgia Governor Test

Former US Sen. David Perdue (R-GA)

By Jim Ellis

Aug. 23, 2021 — The Fabrizio Lee polling firm, conducting a survey for former President Donald Trump’s Save America PAC, recently tested former US Sen. David Perdue opposite the Georgia Republican gubernatorial field including the party’s incumbent, Brian Kemp.

At this point, Perdue has not indicated that he will be on the ballot for any office in 2022, but that did not stop the Trump pollsters from releasing data showing how he would fare as a gubernatorial candidate. Former DeKalb County Executive and ex-state Rep. Vernon Jones, a former Democrat who became a Trump spokesman during the 2020 campaign, is Gov. Kemp’s principal challenger to date.

The Fabrizio Lee poll (Aug. 11-12; 500 likely Georgia Republican primary voters, including 100 Independents who plan to vote in the Republican primary, live interview) finds Gov. Kemp still saddled with tepid approval numbers from the GOP base. His favorability index is 69:27 percent favorable to unfavorable, which does show weakness for an incumbent within his own political party. Comparatively, Trump’s favorability index is 93:6 percent.

In the four-way primary Gov. Kemp fails to reach 50 percent, which would force a runoff vote if this poll were the final electoral result. The ballot test finds the governor leading 41-19-16-3 percent over Jones, Perdue and announced candidate Kandiss Taylor, respectively. The Perdue number is also weak, but his standing changes when another piece of information is given the respondents.

The pollsters isolated Gov. Kemp and ex-Sen. Perdue after telling the survey participants that Trump would support Purdue. Knowing that, the two-way test yields a Kemp lead of only 46-40 percent, with 25 percent saying they are “definitely” voting for Kemp while 20 percent would “definitely” support Perdue. The remainder favoring each man said they would “probably” vote for their stated individual.

The paradigm changes when all of the candidates are added to the ballot test with the respondents having the information that Trump supports Perdue. Under this scenario, it is Perdue who assumes the lead with 41 percent, while Gov. Kemp posts just 26 percent. Jones records 14 percent, and Taylor, a minor 2020 US Senate candidate, again attracts three percent support.

The Trump endorsement also played a factor in the responses for the US Senate race. Here, former University of Georgia and NFL football star Herschel Walker easily outdistances state Agriculture Commissioner Gary Black. Walker has not committed to run, while Black is an announced candidate.

Continue reading →

Florida Polling – What to Expect

By Jim Ellis

Aug. 20, 2021 — Two pollsters released Florida ballot test data yesterday, and the combined results are a likely prelude of what we can expect from the vast multitude of survey research firms that will be testing the Sen. Marco Rubio – Rep. Val Demings general election campaign in the coming year.

Florida Sen. Marco Rubio (R)

Susquehanna Polling & Research (Aug. 4-10; 700 registered Florida voters, live interview) posted their survey result, which found Sen. Rubio topping Rep. Demings by a relatively substantial 50-39 percent clip.

This was immediately countered by a St. Pete Polls survey conducted later in the month (Aug. 16-17; 2,068 registered Florida voters, online) that sees the race already dropping into a virtual dead heat, with Sen. Rubio only holding a two-point edge, 48-46 percent.

Florida polling history suggests we will see this type of divergent pattern among pollsters probably until the next election. In Sen. Rubio’s 2016 re-election race, for example, where he defeated then-Rep. Patrick Murphy (D) with an eight-point victory spread (52-44 percent), most of the pollsters were forecasting a much closer finish.

During the period from Oct. 25 through election day 2016, 11 polls were released covering the Rubio-Murphy race according to the Real Clear Politics polling archives, and while all but one correctly predicted Sen. Rubio would win re-election, only five were within the correct final margin range. The others were forecasting a very close Rubio win of between a virtual tie and four percentage points.

Looking at the Biden-Trump 2020 Florida aggregate research studies tells a similar tale. Again, beginning with polling occurring from Oct. 25 through the election, 19 Florida presidential ballot test polls were published. Only six of the 19 correctly predicted a Trump Florida victory and all of those were close to the final margin of 3.3 percentage points. One of the pollsters who called this race almost exactly was Susquehanna Polling & Research. St. Pete Polls missed, wrongly projecting a close Biden win.

Looking at the FiveThirtyEight statistical organization’s polling firms rating chart, Susquehanna and St. Pete Polls are at parity. Susquehanna rates as the 92nd firm of the top 100, while St. Pete finishes three slots behind them at number 95. Both receive an accuracy letter grade of B+.

Continue reading →

Virginia Polling: Still Close

By Jim Ellis

Aug. 18, 2021 — The co/efficient polling organization has conducted two surveys in the Virginia governor’s race within the last month and both continue to find a toss-up race.

Former Virginia governor, Terry McAuliffe (D)

While the Glenn Youngkin (R) campaign has so far not defined former Gov. Terry McAuliffe (D) in definitive contrasting terms — something that must occur if the Republican is to remain in victory range from a state that is cutting against his party — the numbers still remain close.

In co/efficient’s first August poll, taken for the Virginia Conservatives for Clean Energy organization (July 25-27; 762 likely Virginia voters, interactive voice response system and text), McAuliffe’s lead was 45-40 percent. Six polls, from five different pollsters have been released in this race, and all show both candidates within the 40s. The first co/efficient survey, incidentally, returns the lowest individual support numbers for both candidates.

The second co/efficient survey, released yesterday according to The Hill newspaper (Aug. 8-9; 1,200 likely Virginia voters, interactive voice response system and text), sees a closer ballot test, 47-45 percent in favor of McAuliffe, again returning similar results with their previous study and consistent with all other public polling beginning with WPA Intelligence’s release in early June (McAuliffe 48-46 percent).

Averaging all six public ballot test results, McAuliffe scores a mean of 46.5 percent as compared to Youngkin’s 43.2 percent, which tells us that a group of professional polling teams finds the race as a virtual dead heat with the former governor holding a slight edge. These margins are similar to the 47.7 – 45.2 percent final result that McAuliffe recorded over Republican Ken Cuccinelli in their 2013 governor’s race.

The 2021 race could actually be even closer. Since polling in the past several elections has tended to understate Republican support typically by two or so percentage points, the idea that the current race is nip-and-tuck is even further supported. Additionally, looking at the Democratic primary election, just over 34,000 less people voted in the 2021 Democratic primary than did in 2017. This is opposite of almost all other elections during the same time period that find drastically increased voter turnout percentages.

McAuliffe has already been tying Youngkin to former President Donald Trump, attempting to paint him as an extremist and linking him to a national candidate who fared poorly in Virginia both in 2016 and 2020.

Continue reading →

Newsom Recall Shock Poll

Embattled California Gov. Gavin Newsom (D)

By Jim Ellis

Aug. 10, 2021 — A stark new poll was released for the Sept. 14 California recall campaign, and the surprising results project Gov. Gavin Newsom (D) falling well behind in his battle to remain in office.

While several polls released in the past 10 days showed a weakening of Newsom’s position, the new Survey USA data (Aug. 2-4; 1,100 California adults, 888 registered California voters, 613 likely California recall election voters, 545 California voters who say they will answer the replacement candidate question; online) reveals a more extreme result.

Asked whether the sample of registered California voters would vote to recall the governor, for the first time, a 51 percent majority said they would. Those who support retaining him numbered only 40 percent.

Republicans, a distinct minority in the state but a more motivated group for this election, would vote to recall in an 8:1 ratio. Conversely, Democrats unsurprisingly favor retaining the governor, but by a smaller 3:1 ratio.

The S-USA poll sees a potentially very serious problem for Newsom in the independent category. By a 50-33 percent majority, the non-affiliated respondents would vote to remove him from office. Should this finding prove accurate, Newsom would be in danger of losing his position.

A major difference lies between those saying they are “certain” and “likely” to vote. The certain voters break 57-39 percent in favor of removal; the likely category: 43-36 percent for retention.

Differing patterns arise among racial segments. Whites heavily favor removal, 56-35 percent. Hispanics, by a 47-41 percent margin, do as well. Blacks and Asians are overwhelmingly in Gov. Newsom’s corner, however. Asians favor retention, 62-25 percent, while the small segment of blacks tested are virtually unanimous in their support for the governor.

Survey USA also segmented those claiming to be vaccinated, and those who do not. The unvaccinated, unsurprisingly, are overwhelmingly for the recall, 67-27 percent. Even a plurality of the vaccinated segment, however, also favors the recall: 47-43 percent.

The S-USA pollsters also identified reasons why those supporting the recall are doing so. Most of the responses center around how Newsom has handled the COVID-19 issue. A total of 34 percent said they are voting to recall because of “COVID issues.” Another 18 percent said the state spending is the main reason for their vote to remove Newsom. The unemployment compensation issue, and Newsom’s handling of it, was the significant reason motivating 12 percent of “yes” vote respondents (the position that supports removing the governor from office).

Continue reading →

Poll: Newsom in Trouble

By Jim Ellis

California Gov. Gavin Newsom (D)

July 30, 2021 — The University of California at Berkeley’s Institute of Governmental Studies released their latest Golden State survey that finds Gov. Gavin Newsom’s (D) strength in the upcoming recall election dissipating.

According to UC Berkeley, among likely voters, 47 percent would vote to recall Gov. Newsom and 50 percent would not, clearly the closest ballot test result seen to date. The recall election is scheduled for Sept. 14, and voters will first choose whether to remove the governor from office before choosing a replacement among 46 ballot qualified candidates. The replacement candidates’ votes count only if a majority supports removing the subject from office, in this case Gov. Newsom.

The Berkeley poll (July 18-24; 5,795 registered California voters; 3,266 likely California recall election voters, online) finds Newsom in trouble only among likely voters, those screened as almost certain to participate in the recall election. Within the entire polling sample, he returns to safe territory as the respondents break only 36-51 percent for removing him from office.

The major difference is partisanship. The parties, as one might guess, break in polarized fashion. A total of 91 percent of Democrats would vote against the recall while 95 percent of Republicans favor removal.

The independent and minor party sectors become interesting, however. Among the large No Party Preference group, 46 percent would vote to recall Newsom and 50 percent would not. The combined minor parties, which only account for approximately six percent of the electorate are breaking hard for the recall position. Within the minor party segment, 68 percent would vote to remove as compared to only 30 percent supporting the retain option.

Among Republicans, 90 percent say they are enthusiastic about the election, while 58 percent of Democrats say the same. Among the substantial segment in the “No Party Preference” or independent category, 53 percent say they are enthusiastic.

The polling analysis suggests that the governor’s fundamental problem is that Democrats are “almost unanimous” in their belief that he will win the recall election. This substantially explains the Democrats’ lack of solid enthusiasm for the irregular Sept. 14 stand-alone election.

Continue reading →

VA-Gov: Still Polling Close

Former Virginia governor, Terry McAuliffe

By Jim Ellis

July 15, 2021 — A new Trafalgar Group poll was released this week on the 2021 Virginia governor’s campaign, and the results supported data from two other pollsters that we analyzed in June.

The Trafalgar numbers (July 8-10; 1,104 likely Virginia voters, combination live interview and online) give former Virginia governor and ex-Democratic National Committee chairman Terry McAuliffe a slight 47-45 percent edge over retired hedge fund CEO Glenn Youngkin (R) in a political contest that is much closer than analysts would have foretold at the very beginning of this election cycle.

The Trafalgar results were consistent with those found in June from WPA Intelligence (June 2-6; 508 likely Virginia voters, live interview) and JMC Analytics (June 9-12; 550 likely Virginia voters, live interview). In those surveys, McAuliffe held leads of 48-46 percent (WAPi) and 46-42 percent (JMC). Therefore, we see virtually no change within the five-week period, which has to be considered good news for underdog Youngkin.

None of the three polls published a geographic segmentation, which would have been interesting since Youngkin must hit certain benchmarks in the state’s most populous areas if he is to score an upset. All of these regions have been moving decidedly Democratic in the most recent elections.

Alternatively, if we look at the most competitive previous election result, one that elected McAuliffe, we can begin to pinpoint how the current race must form and if we are to see a Republican upset.

The first clue that a close race might develop came in this year’s Democratic primary held on June 8. Turnout, when compared with the 2017 primary that nominated current Gov. Ralph Northam in a lightly competitive race, reached 542,858. This year, the Democratic participation number fell by more than 34,000 voters to 508,616. This may suggest a lesser enthusiasm factor within the Democratic base for McAuliffe’s rerun campaign.

Continue reading →

SCOTUS Rules; Calif. Recall Scheduled

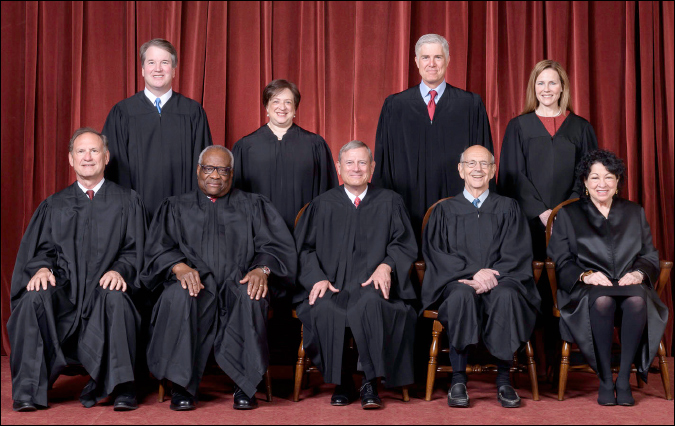
Current US Supreme Court

By Jim Ellis

July 6, 2021 — On their last day of the year’s early session last week, a Thursday, the Supreme Court of the United States issued rulings on the Arizona voting rights case and the California non-profit organization disclosure lawsuit.

In the Democratic National Committee v. Brnovich, the Supreme Court with Justice Samuel Alito writing for the 6-3 majority, ruled that the state of Arizona did not infringe upon minority voting rights or violate Section 2 of the Voting Rights Act in both prohibiting ballot harvesting with certain exceptions, and not counting provisional ballots cast from voters who do not reside in the particular precinct that the polling place covers.

The high court agreed with Arizona Attorney General Mark Brnovich’s (R) arguments that the laws are not racially motivated, nor do they intentionally discriminate against certain segments of the voting population, thus overturning the full 9th Circuit Court of Appeals ruling.

Originally in 2016, Brnovich won at the district court level and on the first appeal to a three-judge panel from the 9th Circuit. The DNC requested an en banc review of the original appellate ruling that agreed with Brnovich, and the entire 9th Circuit membership overturned the decision, siding with the plaintiff. At that point, AG Brnovich petitioned the Supreme Court, which agreed to hear the case. (Hearing cases en banc allows the full circuit court to overturn a decision reached by a three–judge panel. Due to the decreasing probability of U.S. Supreme Court intervention, the circuit court is often the court of last resort in the ordinary life of a case, thereby amplifying the importance of en banc review.)

In his ruling, Justice Alito stated that “every voting rule imposes a burden of some sort,” and that “mere inconvenience cannot be enough to demonstrate a violation of Section 2.” He also cautioned that, “what are at bottom very small differences should not be artificially magnified.”

While agreeing that holding free and open elections is a “valid and important state interest,” he also addressed the voter fraud argument, clearly stating that attempting to prevent such abuses is also a “strong and entirely legitimate state interest.”

In her article discussing these rulings, Supreme Court expert Amy Howe, in her Howe on the Court article that was published on the SCOTUS blog, offered that the Brnovich ruling “will make it more difficult to contest election regulations under the Voting Rights Act,” and thus likely means fewer voting rights cases coming through the courts. She further categorized this decision as a “major ruling.”

Continue reading →