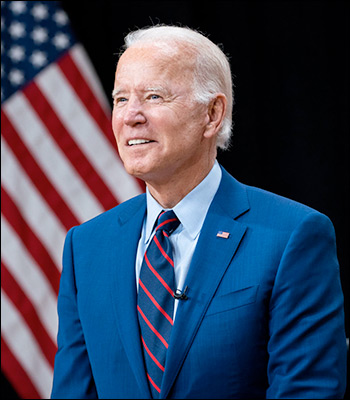
Tag Archives: coronavirus

Biden’s Achilles Heel

By Jim Ellis

President Joe Biden

Jan. 21, 2022 — The International online survey research firm YouGov just released a major US national poll for CBS News reporting upon their respondents’ attitudes and views about President Joe Biden and his administration’s effectiveness, and the segmented data revealed a surprising information point.

In fact, the analysis pinpointed what appears to be a severe area of weakness for the president’s Democratic Party in relation to the midterm elections.

The exhaustive survey, conducted online of 2,094 American adults during the Jan. 12-14 period, focused on the issue areas (in alphabetical order) of Afghanistan, the coronavirus, crime, the economy, inflation, immigration, police and policing, and race relations. In all areas but coronavirus, where the president scored a 52:48 percent favorable rating, his approval score was underwater.

His worst showing came in his handling of inflation. On this issue, the respondent sample expressed unfavorable views about the administration’s performance in a whopping 30:70 percent positive to negative ratio.

While there has been quite a bit of post-2020 election coverage about the Republicans’ improved performance among Hispanics in particular, one group with whom Democrats have gained substantially during the past few elections is among college-educated voters. The Republicans’ diminished vote within this sector is likely a bigger area of concern for party leaders and strategists than how the GOP candidates are performing with minority voters.

Since the Obama presidential election of 2012, the Republican share among college-educated voters has dropped significantly. In fact, it is within this segment where Joe Biden outperformed Hillary Clinton with his greatest increase level. In 2012, President Obama captured 46 percent of the college-educated vote. Four years later, Clinton increased the percentage to 50, and in 2020, Biden’s share rose to 54 percent, or a full eight points better than Obama’s in an eight-year period.

These figures come from the Catalist data trust firm, an entity that bills itself as the “longest running such company in progressive politics,” as reported in a post-election analysis article on the Vox information news site.

The YouGov/CBS poll segmentation categorizes white 4-year college educated voters. Except for the coronavirus and crime issues, this highly educated sector appears to be turning on President Biden. In fact, their negative views on the economy, and particularly inflation, closely mirror the aggregate response, a sampling universe that contains overwhelmingly negative responses from self-identified conservatives.

Continue reading

Examining California
Gov. Newsom’s Vulnerabilities

By Jim Ellis

California Gov. Gavin Newsom (D)

May 13, 2021 — The University of California at Berkeley’s Institute for Governmental Studies released another of its periodic polls this week, and while it finds Gov. Gavin Newsom (D) surviving the upcoming recall election it also identifies areas of underlying weakness.

According to the survey (April 29-May 5; 10,289 registered California voters with questions asked in English and Spanish, online), Gov. Newsom would win the impending recall vote as 49 percent of the respondents said they would vote to retain him in office and 36 percent support removal. Regarding his job approval and performance on certain issues, however, the poll identifies what could possibly become an opponent’s path to victory.

The Cal-Berkeley result is very similar to another poll conducted within the same time period. Survey USA went into the field during the April 30 – May 2 time segment and interviewed 750 California registered voters of which 642 were identified as likely to vote in the gubernatorial recall election. S-USA found the sampling universe broke 47-36 percent in favor of Gov. Newsom remaining in office, almost identical to Cal-Berkeley’s tally from their much larger online sample.

Cal-Berkeley delved deeper into how the respondent sample was viewing the governor’s job performance and his standing within the electorate, and its results suggest that a focused opposition campaign could yield a close outcome.

Perhaps most troubling to the Newsom strategy team is the question that tested enthusiasm within the electorate. While Democrats were breaking 75-8 percent to retain the governor, the enthusiasm metric showed that only 36 percent of them have a high interest in the election. Another 30 percent fell into a moderate interest level, and 34 percent of the self-identified Democratic voter base said they had little or no interest.

Republicans, on the other hand, registered a 75 percent high interest level, suggesting that their turnout for the eventual election will be much greater. Though Democrats hold a large 46-24 percent party registration advantage, the interest level suggests the eventual election result could fall into a closer range. Among GOP voters, the governor would be ousted in a whopping 85-8 percent margin.

Those registering under the No Party Preference category, who account for another 24 percent of the California voting universe, would retain the governor with a 45-33 percent margin, while the six percent who identify with a minor party break 48-29 percent for removal.

Overall, Gov. Newsom’s job performance improved from Cal-Berkeley’s late January poll and stands at a 52:43 percent positive to negative ratio. In January, the performance ratio was an upside-down 46:48 percent. This is largely due to improvement regarding his handling of the Coronavirus issue, as 45 percent rate his performance as excellent or good, while 35 percent say poor or very poor. Another 16 percent gave him a fair rating, which on this poll seems to indicate a moderate support level as opposed to leaning in a negative direction as some other pollsters characterize the term.

Continue reading

Louisiana Special Election Poll Suggests at Least One District Runoff

Louisiana congressional districts


By Jim Ellis

March 15, 2021 — Two of the upcoming special elections to fill vacancies in the US House will occur next weekend, and a new Louisiana poll suggests one of them will likely advance two candidates into a secondary April 24 runoff election.

The Edgewater Research/My People Vote survey tested 651 likely voters in Louisiana’s vacant 2nd Congressional District over the March 2-7 period in preparation for the March 20 jungle primary election. A likely voter for purposes of this study were people who have voted at least seven times in the last 10 statewide elections.

The pollsters, however, only named three of the 15 candidates on the ballot in testing the electorate. The query asked if the respondent is supporting “Troy Carter, Karen Carter Peterson, Gary Chambers, or someone else.”

The names refer to state Sens. Troy Carter (D-New Orleans) and Karen Carter Peterson (D-New Orleans), and Baton Rouge community activist Gary Chambers. No Republican was named in the survey even though author Claston Bernard and Greg Lirette have raised more money than Chambers, for example. The latter man, however, is well known as an activist who attracts a great deal of attention in the Baton Rouge media market.

The ballot test found the electorate breaking 35-24-11 percent in favor of Sen. Carter, with Peterson and Chambers following, respectively. The response for “someone else” was 16 percent. Sen. Carter, however, leads Sen. Peterson only 39-35 percent among Democratic voters, the dominant party in this district that captures most of the city of New Orleans and meanders northwest to include heavily African American Baton Rouge precincts.

The 2nd District basically divides into just two races: black and white. Of the citizen voting age population, blacks account for 61.5 percent and whites 31.7 percent. All other race categories comprise the remaining 6.8 percent of the demographic composition.

Within the black vote, Sen. Carter leads Sen. Peterson, 40-26 percent with Chambers getting 11 percent and someone else 8 percent. Within the white vote, the contest is much closer. In this case, the someone else category places first at 28 percent with Sen. Carter then topping Sen. Peterson in a much tighter 23-20 percent spread. Chambers had 10 percent support in the white category.

Continue reading

Cuomo Poll: Retirement Seen As
Preferential Over Resignation

By Jim Ellis

New York Gov. Andrew Cuomo (D)

March 8, 2021 — A new Quinnipiac University poll of the New York electorate (March 2-3; 935 self-identified NY registered voters, live interview) was released late last week after his press conference with mixed results for embattled Gov. Andrew Cuomo (D).

While his numbers are consistently bad with Republicans and Independents, the governor remains strong with his dominant Democratic base. Thus, while a majority of the Q-Poll respondents don’t favor the governor resigning, a large number believes he should not seek re-election in 2022.

To begin, the governor’s favorability ratio is 45:46 percent favorable to unfavorable, which is not particularly bad considering the negative effects of his dual-scandal situation, one involving COVID-related nursing home deaths and the other sexual harassment claims from former staff members.

The positive rating, however, is almost exclusively from Democrats. By a margin of 65:27 percent, self-identified Democrats still view the governor’s job performance positively. Republicans are wholly opposed, 13:82 percent positive to negative, and Cuomo is also decidedly upside-down with Independents, 33:57 percent.

Surprisingly, the polling sample still gives him positive reviews for his handling of the Coronavirus situation (56:41 percent), but, again, most of the favorable ratings come from Democrats, 80:18 percent, while Republicans and Independents both hold strongly negative opinions about how the governor has managed COVID-19: 17:80 percent among tested Republicans; 42:54 percent among Independents.

Once a small number of Democratic officials opened the spigot of dissent toward the governor, many more joined to form a high-flowing chorus. The calls for Cuomo’s resignation aren’t having much effect, however, as a majority, 55:40 percent, do not favor the governor giving up his office before his term ends. As mentioned above, however, the same polling sample does believe he should not seek a fourth term next year, and on this question, even the Democratic response is close.

Overall, 59 percent of the respondents say he should retire at the end of this term, while 36 percent believe he should run again. The Republican pro-retirement ratio registers 90:9 percent. Virtually two-thirds of the Independents (66:28%) say he should retire at the end of next year, while Democrats still barely back him remaining in office after the next election, 50:44 percent.

Continue reading

Newsom Recall Election Likely

By Jim Ellis

California Gov. Gavin Newsom (D)

Feb. 15, 2021 — Proponents of the recall effort against California Gov. Gavin Newsom (D), with more than a month remaining until the March 17 deadline to collect the necessary number of valid signatures, are already close to forcing a removal election.

Five other attempts have been made to recall Gov. Newsom, but this is the first that had a serious prospect of qualifying. According to the latest poll of the state’s electorate, dissatisfaction with both the governor and the state government’s response to the COVID-19 pandemic has led to the uprising.

Under California election law, state officials can be forced to stand for a recall election if a number of registered voters equal to 12 percent of the total number of votes cast in the most recent governor’s election, in this case the 2018 contest, sign a state certified petition. The total number of qualified signatures needed for the 2021 recall must equal a minimum of 1,495,709. Yesterday, the proponents reported that they have collected 1.47 million signatures. To ensure qualification, the organizing committee members have a goal of obtaining over 1.8 million signatures.

CALIFORNIA GOV. NEWSOME RECALL EFFORT:

 • Signatures Needed • Signatures Collected
 1,495,709 1,470,000
 • Signatures Reviewed • Signatures Validated
 485,650 410,087
 • Signature Approval Rate • Total Signatures Needed
 84.4% 1,772,169

At this point, the Secretary of State’s staff has reviewed 485,650 of the submitted signatures according to the FiveThirtyEight statistical website, and 410,087 have been ruled valid. This translates into an approval rate of 84.4 percent. If this ratio were to continue, the proponents would have to submit a minimum of 1,772,169 signatures. At their most recent reported gathering rate of over 100,000 signatures per week, they should easily reach their quota.

The University of California at Berkeley’s Institute of Government Studies released their latest statewide survey (Jan. 23-29; 10,357 registered voters from online stratified random samples) and compared it with the results from their September 2020 poll. The results show a significant deterioration in the governor’s support base in the short period between the two research studies.

Continue reading

Sen. Lindsey Graham’s Challenge

By Jim Ellis

Is incumbent Sen. Lindsey Graham (R-SC) in re-election trouble?

Sept. 18, 2020 — Quinnipiac University surveyed the South Carolina political situation as part of their three-state polling series, which again produces some eyebrow-raising data. The results help identify why Sen. Lindsey Graham, a Republican senator from a Republican state, finds himself languishing in a competitive contest.

The poll (Sept. 10-14; 969 likely South Carolina voters, live interview conducted by the RDD firm for Quinnipiac) tested both the presidential and Senate campaigns. President Trump leads former vice president Joe Biden 51-45 percent in a ballot test that seems to be an under-count when looking at the survey’s supporting numbers. Sen. Graham, however, falls into a tie with opponent Jaime Harrison, at 48-48 percent, in a result that the underlying responses do seem to support.

President Trump’s six-point lead appears low because he tops Biden on virtually every personal and issue question. The Trump favorability index is 51:45 percent positive to negative, but the Biden ratio is much worse at 43:50 percent. The generic Republican-Democrat number falls 52-44 percent in favor of the GOP label.

Despite poor coronavirus management numbers for the president nationally, this South Carolina survey returns a 49:48 percent approval number on his handling of the issue. Furthermore, the respondents, in a 50-46 percent break, believe President Trump would do a better job handling coronavirus in the future than Biden. Not a particularly strong performance in this issue area, but better for the President than in almost any other place.

Trump also scores better in his handling of the economy (55-40 percent), the military (54-42 percent), and “keeping your family safe” (52-43 percent). Biden is favored, and only barely, 48-46 percent, on just one issue: racial equality.

Most importantly, the issue matrix sets up perfectly for Trump. The top two issues, according to these respondents, are the ones upon which the president is basing his campaign, law and order (23 percent) and bringing back the economy (22 percent). The Biden key issues rate rather poorly: coronavirus (12 percent), racial equality (12 percent), and healthcare (10 percent).

All of these underlying numbers suggest the Trump ballot test margin should be stronger than six points, which could be a signal that there is a “shy Trump voter factor” even in what is typically a safe Republican state. The “shy Trump voter” is the phrase now used to describe the individual who only secretly favors the president.

Continue reading

Beneath the Numbers

By Jim Ellis

Is Maine Sen. Susan Collins (R) in trouble?

July 30, 2020 — Two Senate polls were released earlier this week, and though the ballot tests in Maine and South Carolina didn’t show us anything particularly new, the pollsters asked their respective sampling universes some interesting ancillary questions.

Colby College, a Waterville, Maine institution housing approximately 1,800 students, released its second political poll of 2020 in conjunction with the McVey Data Science Initiative. The questions touched upon the presidential and Senate ballot tests but delved deeper into the attitudes and perspectives of their 888-person sample over the July 18-24 period.

The presidential ballot test found former vice president Joe Biden leading President Trump statewide, 50-38 percent. The Senate ballot test was closer in that former state House speaker Sara Gideon (D) leads Sen. Susan Collins (R), 44-39 percent.

In looking deeper, it is probable that the actual race standings are likely a bit closer. There appears to be a Democratic skew in that all favorability indexes for Democratic public officials were positive and those of the tested Republican officials were decidedly negative. Additionally, 52 percent of the sampling universe comes from the state’s southern congressional district, the 1st, which is decidedly more liberal than the northern 2nd District. Together, these factors provide us the indication that the results are a few points more favorable for Democrats than what we might see in actual voting.

Continue reading