By Jim Ellis

California Rep. Karen Bass (D-Los Angeles)
— Reports were surfacing last week that California Rep. Karen Bass (D-Los Angeles), who had been on candidate Joe Biden’s short list for the vice presidential nomination, was deciding whether to eschew re-election next year for a chance to run for LA mayor. Now, she has made the decision. On Monday, Rep. Bass formally entered the citywide race.
The mayor’s election likely will be semi-open. Mayor Eric Garcetti (D) has been nominated as US ambassador to India, and upon obtaining his Senate confirmation, the City Council will be empowered to appoint an interim mayor. That individual will have the opportunity of then seeking a full four-year term during the regular election cycle. Certainly, Rep. Bass could be a potential appointee. Should Mayor Garcetti not receive a timely confirmation as ambassador, he would be ineligible to seek a third term, so in any event, the mayor’s contest will be highly competitive.
From a federal perspective, Bass running for mayor means her 37th Congressional District will be open. Of the 18 congressional districts that are wholly or partially contained within Los Angeles County, 17 of them need a population influx. With California losing a seat, it appears that the Los Angeles area will absorb the reduction.
Since Rep. Bass is the first Golden State House member to announce that he or she won’t seek re-election, her 37th District that needs 38,173 people to meet the state’s CD population quota of 760,350 people for the new 52 district map – a west Los Angeles County seat centered around the Culver City community – now becomes a prime target for elimination.
In the mayor’s race, Bass will at least face Los Angeles City Council President Pro Tempore Joe Buscaino, LA City councilman and former state Senate president and ex-US Senate candidate Kevin de Leon, and LA City Attorney Mike Feuer. It is likely others will enter the race once the political situation surrounding Mayor Garcetti is defined, and the congressional and legislative redistricting picture becomes clearer.
Redistricting Update
Several states are making progress in drawing new congressional maps. Colorado will send a final plan to the state Supreme Court as early as today. Indiana and Maine are close to finalizing maps that will strengthen both states’ political divisions, 7R-2D in the Hoosier State, and 2D-0R in the latter.
Oregon is also moving toward completion of a map that may prove a reach for the Democratic majority. Gaining a sixth seat in national reapportionment, the Democrats are trying to craft a 5D-1R map. Though Republicans have a significant base in the state, the Democrats maintain a tight grip on the statewide races thanks to dominant Portland, which serves as the lynchpin to their Beaver State political success.
Therefore, though the Dems have a clear edge in five of the new CDs, the early partisan analysis figures suggest that the Republicans would have at least an outside chance of prevailing in one of the districts, most likely that of Rep. Kurt Schrader (D-Canby/Salem), and possibly in the new 6th District open seat. More will be known when in depth political data is available and candidates begin to come forward.
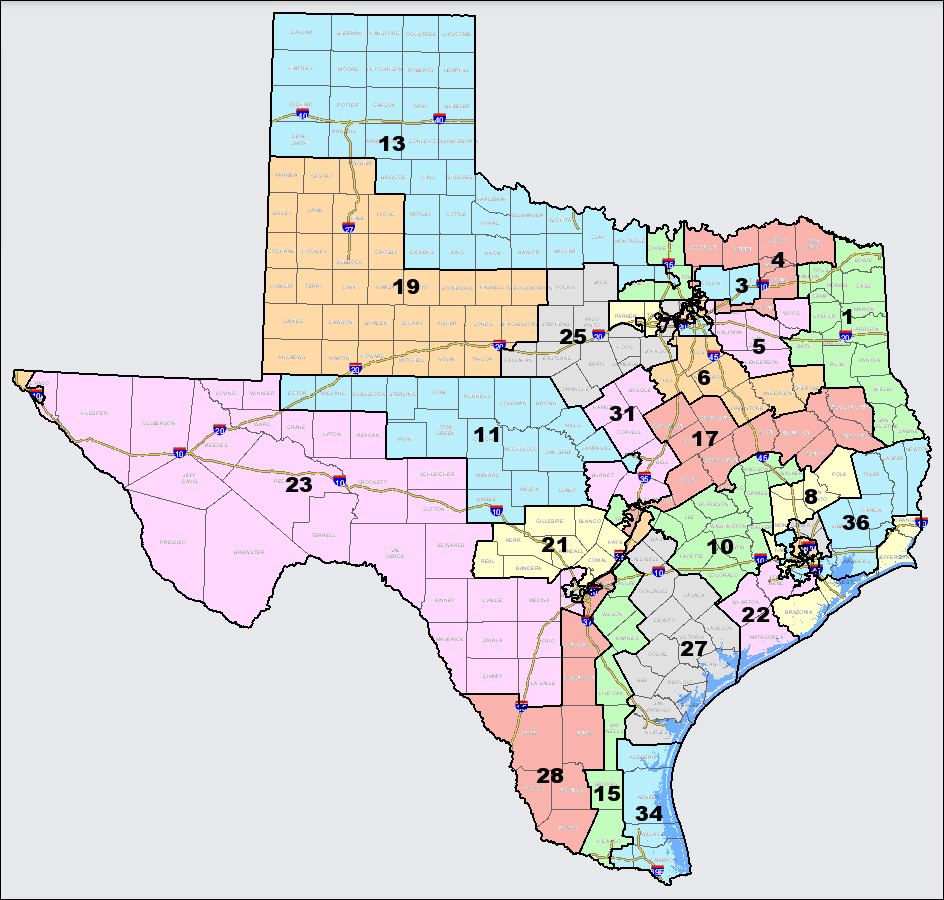
The Texas Republican Senate’s congressional map was unveiled yesterday. As predicted, the GOP map drawers used the state’s two new seats as somewhat of a buffer, at least in the Austin area, to strengthen districts that were showing weakness. Should this map be enacted, Reps. Chip Roy (R-Austin), Michael McCaul (R-Austin), John Carter (R-Round Rock), and Roger Williams (R-Austin) all receive much stronger Republican seats. In exchange, one of the new seats goes to Travis County and will await a new Democratic inhabitant.
The other new seat appears destined for Harris County. There, sophomore Rep. Lizzie Pannill Fletcher (D-Houston) moves from a political marginal district to a rock solid Harris-Ft. Bend County Democratic District. This allows the second new seat to fall to a Republican and be fully contained within Harris County. In the northern part of the region, Rep. Dan Crenshaw (R-Houston) receives a substantially better district, and assumes part of Republican Montgomery County.
In the Dallas-Ft. Worth Metroplex, the region doesn’t get a new district, but a reconfiguration allows all incumbents, both Republicans and Democrats, to improve upon their present internal political standing.
This Texas map is a long way from enactment. The state House Democrats are unified to vote against any Republican map, and while the GOP has the strength to pass what they want in the Senate, the state House is a different story. It is likely we will see the current 30-day special session end in deadlock, with another 30-day session to follow. The Democratic strategy is to force the redistricting process to court, while the Republicans will attempt to pass a series of maps into law. Expect this story to be with us for many weeks to come.