By Jim Ellis
 March 5, 2020 — Tuesday’s elections in Texas and California were subject to slow counting, but at least in the Lone Star State, the numbers are near final.
More than 780,000 votes have currently been received in California but not yet counted. More votes are coming into county offices. To be valid, voters could have postmarked their mail ballots on Election Day and as long as they are received in the county election offices by close of business on March 6, they will be counted. Therefore, an unknown number will be added to the received but uncounted total.
The large total explains why some of the California congressional races remain uncalled even though the vote spreads among the affected candidates is sometimes quite large.
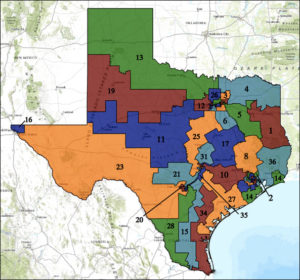
Map of US Congressional districts in Texas
The final unofficial Democratic presidential tally finds former vice president Joe Biden scoring 34.5 percent of the vote as compared to 30.0 percent for Sen. Bernie Sanders (I-VT). Though Biden and Sanders were the only candidates to break the 15 percent barrier to qualify for at-large delegates, former New York City mayor Michael Bloomberg and Sen. Elizabeth Warren (D-MA) both obtained the threshold percentage in certain congressional districts, so they, too, earned several delegate votes; both, however, have ended their campaigns, Sen. Warren just this morning. The final unofficial delegate board finds Biden capturing 111 bound Texas first-ballot delegates, Sen. Sanders 102, Bloomberg 10, and Sen. Warren, five.
Just over 2 million people voted in the Democratic presidential primary. President Trump garnered 94 percent of the Republican vote, translating into more than 1.863 million votes. Just under 2 million voters cast ballots in the GOP primary despite there being no real race for president.


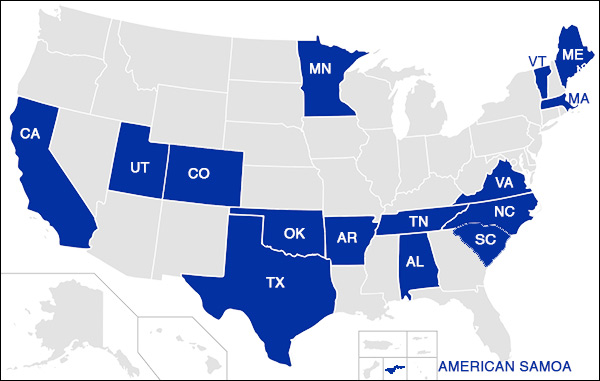


 Jan. 23, 2020 — A total of 35 US Senate races will adorn the various state ballots this year, and the nomination process will begin in five states on Super Tuesday. Voters in Alabama, Arkansas, North Carolina, and Texas will make Senate candidate choices on March 3 since their domains have linked the statewide primary concurrently with the presidential primaries. The remaining Super Tuesday statewide primary state, California, does not host a Senate race in this election cycle.