
Tag Archives: Georgia

Disputing the Georgia Poll

By Jim Ellis

Former DeKalb County, Georgia chief executive officer and ex-state representative, Vernon Jones

May 11, 2021 — At the end of last week, the Remington Research Group released a survey of the Georgia 2022 Republican gubernatorial primary for their client, former DeKalb County chief executive officer and ex-state representative Vernon Jones. The results were met with some derision.

The poll (May 1-3; 1,040 likely Republican primary voters, interactive voice response system) finds Gov. Brian Kemp leading Jones only 39-35 percent, and an Atlanta Journal Constitution reporter responded with negative comments about the poll’s credibility and cited unnamed GOP consultants who allegedly agree with this analysis.

Greg Bluestein of the AJC said in response to the poll’s publishing, “suffice it to say we have not found one person with proven knowledge about Georgia politics who believes the poll is credible.” He further stated that, “the last two independent polls I’ve seen show Gov. Kemp leading Jones 74-17 percent and Kemp up 64-14 percent.” There is no evidence that these latter polls have been publicly released, however.

To reject the Remington poll in such a manner should not be considered a legitimate response. The Remington Research Group is a national pollster that specializes in interactive voice response systems and are certainly a well-established survey research firm.

According to the FiveThirtyEight statistical website that ranks polling firms, we find the RRG earning a B grade and placed as the 103rd entity of the 482 polling organizations in the FiveThirtyEight universe. This means the pollster lands in the top 22 percent of all tested survey research firms. Therefore, to reject Remington’s latest Georgia findings as not credible is an analysis and comment trail that should be discounted.

Gov. Kemp’s popularity among Georgia Republicans clearly suffered after the election controversy in his state. At the low point, according to the Morning Consult data intelligence firm, his personal favorability rating stood with a 62:31 percent positive to negative ratio among members of his own party, which is touching the danger zone for any office holder.

Continue reading

Senate Action

Ohio Rep. Tim Ryan (D-Warren/Youngstown)

By Jim Ellis

April 29, 2021 — While most of the political world was focused on the census’s national apportionment announcement, several Senate moves of merit were also made this week.

In Ohio, US Rep. Tim Ryan (D-Warren/Youngstown) finally made his fledgling US Senate campaign official. Originally saying he would announce sometime in March only to postpone formal entry to an undetermined time, Ryan finally made his declaration on Monday. Once former Ohio Health Director Amy Acton — who was running slightly ahead of Rep. Ryan in early Democratic primary polling — said that she was not going to run, that paved the way for the 10-term congressman to open with an apparently clear path to the Democratic nomination.

Simultaneously, in Georgia, another announcement was made but one that contained a surprising message. Former Rep. Doug Collins (R), who placed third in the 2020 US Senate jungle primary, also declared his political intentions for 2022 on Monday. While observers were expecting the former four-term congressman to enter the current Senate race, he instead said he will not run for any office next year but didn’t close the door on returning to elective politics in another election cycle.

Yesterday, in another largely expected move, former North Carolina state Supreme Court Chief Justice Cheri Beasley (D), who lost her position in November by a scant 401 votes statewide, announced via video that she will enter the open Tar Heel State Senate race.

The three moves help further set the stage for a trio of critical Senate contests that will each contribute mightily toward determining which party breaks the 50-50 tie and assumes control of the body after the next election.

Despite Rep. Ryan looking as the candidate to beat for the Ohio Democratic nomination, the general election won’t be easy. Additionally, this political cycle could be different in terms of political options for Ryan. He has several times dipped his toe in the statewide or national waters only to return to the safety of his House district. With it now a certainty that Ohio will lose another congressional seat, and with at least one scenario suggesting that the eliminated seat could become Rep. Ryan’s 13th District, his usual fail-safe move might not again be available.

Continue reading

Analyzing the 2020 Turnout Increase

By Jim Ellis

March 29, 2021 — As we know, election year 2020 produced the largest voter participation level in history, including a substantial increase from the last presidential turnout in 2016. Now that all states have reported finalized election numbers, we know that a total of 158,507,137 individuals cast ballots in the 2020 presidential election, a number that shattered even the highest pre-election turnout predictions.

The figure also represents a 15.9 percent turnout increase when compared with 2016, which, at that time also set a record for raw number voter participation. Attempting to explain the large jump, the proponents of the election system overhaul legislative package in Congress, HR-1/S.1, credit the rise to the heightened use of early and mail voting, and therefore want to make permanent most of the court ordered COVID-19 pandemic response procedural changes. Digging deeper, however, we find that there are other factors present that help explain the voting uptick.

While all but five states (Alabama, Connecticut, Mississippi, Missouri, and New Hampshire) employed some form of early voting, another five conducted their elections only through the mail. The usual all-mail states of Colorado, Oregon, and Washington were joined by Hawaii and Utah according to the Ballotpedia election statistics organization that regularly publishes related data.

All five of these latter states saw turnout growth rates that exceeded the national average, including the state posting the highest increase, the Aloha State of Hawaii, which saw a whopping 32.5 percent rise in voting.

As stated earlier, the national average turnout increase when comparing the 2020 figures with 2016 is 15.9 percent. Eighteen states saw an increase greater than the national mean average, while 32 states and the District of Columbia fell below that number. All 51 entities, however, reported an upsurge in voting from 2016. The median average calculated to an increase of 12.8 percent.

Let’s concentrate on the 10 states with the highest increase from 2016. They are:

STATE        PERCENT INCREASE
Hawaii 32.5%
Arizona 31.6%
Utah 31.5%
Texas 26.2%
Idaho 25.8%
Nevada 24.9%
California 23.4%
Washington 23.2%
Tennessee 21.8%
Georgia 21.5%

Continue reading

Georgia: New Poll, Same Story

By Jim Ellis

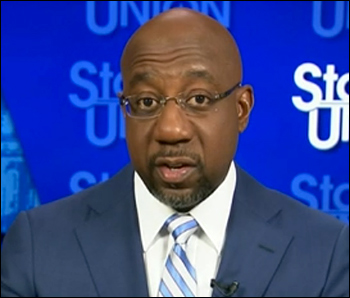
Sen. Raphael Warnock will face an interesting challenge depending upon who emerges from the Republican primary.

March 18, 2021 — The Trafalgar Group and the Insider Advantage entity, both Atlanta-based firms, partnered to test the politically beleaguered Georgia electorate about freshman Sen. Raphael Warnock’s (D) standing as he looks to run for a full six-year term in 2022.

Being one of the top battleground states in the 2020 presidential contest and hosting two US Senate campaigns last year, 56 public polls were conducted of this electorate from July of last year through the Jan. 5 runoff election. Almost all of them repeatedly showed results within the margin of error on the presidential and both US Senate races; and, with the final total showing President Biden and former President Trump separated by just 11,779 votes while the Senate races came down to one and two-point finishes, the polling proved correct.

Now we see Trafalgar and IA beginning the 2022 Georgia election cycle polling. The new survey (March 7-9; 1,093 likely Georgia voters, interactive response system and online) again finds very tight hypothetical Senate race results. Because Sen. Warnock won the special election in January, he must stand for election to a full six-year term in 2022.

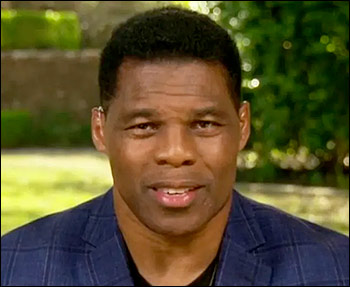
Trafalgar and IA tested three Republicans against Sen. Warnock: former Sen. Kelly Loeffler, ex-US Rep. Doug Collins, and the past University of Georgia and NFL football star Herschel Walker. None of the three have announced their candidacies but all confirm they are considering the race.

According to the results, Sen. Warnock fares best against the woman he defeated in January, ex-Sen. Loeffler. In this ballot test, he leads 46-41 percent. Both Collins and Walker perform better, especially the latter. The Warnock edge narrows to one point against Collins, 46-45 percent, and the new incumbent actually drops behind Walker, 46-48 percent. Notice that Sen. Warnock records 46 percent against all three potential opponents suggesting that he is vulnerable heading into what promises to be another hard-fought Peach State US Senate battle.

While the pollsters tested the job approval ratings for both President Biden and Gov. Brian Kemp (R), they surprisingly did not include such a question regarding Sen. Warnock.

The approval ratios were poor for both the president and governor. Biden scored a 41:55 percent favorable to unfavorable job approval rating, with 32 percent strongly approving and a large 46 percent strongly disapproving.

Gov. Kemp continues to show weakness as he heads into what will be a difficult run against his former opponent, ex-state House Democratic Leader Stacey Abrams. The governor is again in upside-down territory, recording a 33:53 percent negative approval rating. Only nine percent responded that they strongly approve of the governor’s performance while 26 percent strongly disapproved.

At this point, the pollsters asked Republican primary questions to those most likely to vote in the 2022 GOP nomination election.

If Loeffler, Collins and Walker were all to oppose each other in the Senate primary, we see the latter two men virtually tied at 32 percent apiece. Loeffler trails with 24 percent support.

A Collins-Loeffler match would favor the former, as the ex-north Georgia congressman would record a strong 52-32 percent lead. Walker would lead Collins 50-36 percent in a one-on-one match-up, and the former football player would hold a commanding 62-26 percent advantage over Loeffler.

The Georgia Republican respondent cell is strongly pro-Donald Trump with 70 percent saying they would “absolutely” vote for the former president if he were to run again. Only 14 percent of this sample cell said they would vote for anyone other than Trump. Another eight percent said they would consider voting for the ex-president.

We can expect another very active Georgia election cycle, with the Senate and governor’s race assuredly being covered as if they are national campaigns.

Missouri Sen. Roy Blunt to Retire

By Jim Ellis

Missouri Sen. Roy Blunt (R)

March 10, 2021 — Missouri Sen. Roy Blunt (R) announced via video yesterday that he is not seeking a third term next year. He will conclude an era of elected public service that spanned 14 years in the House in addition to completing a dozen years in the Senate. Prior to his federal career, he served as Missouri’s secretary of state, was the Greene County clerk, ran for governor, and saw his son elected governor.

The Blunt exit brings the number of Republican open Senate seats to five and could soon go to seven if Sens. Chuck Grassley (R-IA) and Ron Johnson (R-WI) follow suit. Sen. Grassley will turn 89 years of age before the next election, and Sen. Johnson originally made a two-term promise when he first ran in 2010. The other announced GOP retirees are Sens. Richard Burr (NC), Pat Toomey (PA), Rob Portman (OH), and Richard Shelby (AL).

Without Sen. Blunt in the 2022 race, we can expect a contested Republican primary. Potential candidates include Lt. Gov. Mike Kehoe, Secretary of State Jay Ashcroft, the son of former senator and US Attorney General John Ashcroft, and US Reps. Ann Wagner (R-Ballwin/St. Louis County), Blaine Luetkemeyer (R-St. Elizabeth/Jefferson City), Sam Graves (R-Tarkio/St. Joseph), Billy Long (R-Springfield), and Jason Smith (R-Salem/Southeast MO) among others.

Resigned Gov. Eric Greitens, who was forced from office due to a sex scandal, was beginning to talk about launching a primary against Sen. Blunt, so in an open-seat situation he will be another person whose name will regularly surface.

We’re seeing almost the opposite response among Democrats. The initial public comments from two of the most well-known Missouri Dems, former Sen. Claire McCaskill and 2016 nominee Jason Kander, who held Sen. Blunt to a tight 49-46 percent win in 2016, both immediately indicated that they will not run in 2022. Thus, a previously announced Senate candidate, former state Sen. Scott Sifton, apparently becomes the early leader for the party nomination.

Continue reading

Perdue Changes Course in Georgia

By Jim Ellis

Former Georgia Sen. David Perdue (R)

Feb. 25, 2021 — Just when former Sen. David Perdue (R) appeared prepared to challenge new Sen. Raphael Warnock (D) in the 2022 general election, he abruptly reversed course and announced Tuesday that he will not run. Perdue had filed a 2022 campaign committee with the Federal Election Commission, but such action does not make one an official candidate.

Without Perdue in the 2022 race, the fight for the Republican nomination becomes a free-for-all. Earlier in the week former Sen. Kelly Loeffler (R), who lost her Jan. 5 Senate runoff election, as did Sen. Perdue, confirmed that she is considering running in 2022 in addition to forming a grassroots organization with the goal of increasing right-of-center voter registration in Georgia.

Former Rep. Doug Collins (R), who lost in the 2020 special Senate election, placing behind Sens. Warnock and Loeffler in the crowded jungle primary, also said that he is considering a new run for the Senate, or even a potential Republican nomination challenge to Gov. Brian Kemp.

Yesterday, Atlanta Journal Constitution political reporter Greg Bluestein listed several more Republicans who apparently have not yet ruled out a Senate bid next year. They are: Lt. Gov. Geoff Duncan, Attorney General Chris Carr, Agriculture Commissioner Gary Black, and former US Ambassador to Luxembourg Randy Evans.

In the Nov. 3 special jungle primary, Rev. Warnock captured the highest vote total, 1,617,035 of 4,914,361 ballots cast from within a field of 20 candidates. Sen. Loeffler placed second, 292,760 votes ahead of third place finisher Collins.

The fact that Loeffler finished substantially ahead of Collins will be one argument she will likely use to convince base voters that she is most able to defeat Sen. Warnock this time around. Collins, conversely, will contend that a Republican primary is very different than a special election in a regular voting schedule, thus suggesting that he is better positioned to win a primary nomination and develop a stronger base from which to oppose Sen. Warnock.

With Georgia changing politically, any Republican nominee is going to have a difficult time unseating Sen. Warnock but doing so is certainly within the realm of possibility. In the Jan. 5 runoff, while both Loeffler and Perdue were losing to their respective Democratic opponents, a third race was also on the ballot.

Continue reading

Perdue Making Moves in Georgia

By Jim Ellis

Former Georgia Sen. David Perdue (R)

Feb. 19, 2021 — Defeated Georgia Sen. David Perdue (R) is taking the first steps toward making a quick political comeback. This week he filed a new 2022 US Senate campaign committee with the Federal Election Commission to explore his prospects against new Sen. Raphael Warnock (D), who will be standing for a full six-year term after winning the 2020 special election. Perdue says he will make a final decision about launching his candidacy next month.

One of the former senator’s arguments to support a new campaign is that he “won” the November general election, which, he points out, drew a record high turnout.

Using the term “won” might be a stretch because we obviously know that Georgia has a runoff system even for the general, which must be satisfied to actually win, but he did finish 88,098 votes ahead of Jon Ossoff in the first election in which 4,952,175 people cast ballots. This total, however, was only enough for 49.73 percent of the vote, a scant 0.27 percent from clinching the seat.

The Jan. 5 runoff turned out differently, as these types of elections often do when an incumbent fails to achieve majority support in the first vote. That is, the second-place finisher frequently wins.

In January, now that the final votes are tabulated and certified, Ossoff produced a 54,944-vote edge from a participation factor of 4,484,902 voters, meaning 467,273 fewer individuals took part in the runoff election. This drop-off rate of only 9.4 percent, however, is the lowest ever for this type of a secondary electoral contest. The typical participation rate falls by at least one-third.

Therefore, Perdue’s argument that he “won” the record turnout election is less credible when understanding that the runoff had a small drop-off rate, and its turnout as part of the super-charged 2020 election cycle is well beyond a standard midterm participation factor.

Additionally, while a Perdue 2022 entry might dissuade other potential Republican nomination contenders such as former Sen. Kelly Loeffler, who campaigned closely with Perdue as part of their Republican team effort, it apparently isn’t yet stopping at least one other potential rival.

Continue reading

More Redistricting Delays – Part I

By Jim Ellis

Feb. 17, 2021 — The Census Bureau announced just before the Presidents’ Day holiday break that there will be yet another long delay in transmitting the census data to the states. Without the new numbers, redistricting becomes unachievable.

The new target date is Sept. 30, postponed from their first postponement date of July 30. At this point, the postponed apportionment release date remains April 30, long after the statutory deadline of Jan. 1. Apportionment is the first critical step in the redistricting process since this informs the states how many congressional seats they will be awarded for the current decade.

The late September target (and there’s no guarantee even this date will be met) will make it difficult for many states to finish their redistricting on time, and could force the process into the courts if state legislatures are unable to convene or meet a legislative calendar in terms of allowing public input. Even now, at least several states will have to enact emergency legislation to change deadlines to avoid violating pre-existing legal redistricting deadlines.

The delays have already changed the political situation in New Jersey and Virginia. With both states having odd-numbered year state legislative elections, the two are always the first to receive their new census data. In both states, legislative elections will now proceed under the 2011 maps with previously enacted amendments. When the lines are eventually completed, it is possible that new elections, possibly for 2022, will be ordered in Virginia. New Jersey voters passed a referendum in November that allows redistricting to occur before the 2023 state legislative elections.

Another problem could be lawsuits filed against the eventual apportionment. Apparently, the principal problem for the delays is exactly which people to count and where they are placed. College students, for example, are typically counted at the university campus on which they reside. Now, however, so many are not attending in-person classes. Therefore, arguments are ongoing as to where this group should be counted, either at school or back at their primary residence.

Additionally, one of President Biden’s new executive orders reversed Trump Administration policies about whether or not to count non-citizens. This change of direction has also created further delays.

Based upon these controversies, and others, it is probable that at least one potential losing state – apparently Alabama is on the cusp of losing a seat but may not depending upon the counting criteria – could sue over the apportionment conclusion meaning even further delays as various potential lawsuits wind their way through the judicial process toward final determination. All of this could conceivably mean redistricting is postponed until the 2024 election cycle.

Continue reading

Early House Outlook – Part IV

By Jim Ellis

Jan. 24, 2021 — Concluding our electoral US House preview, today we look at the final dozen states in the country’s southern region.


• Alabama – 7 Seats (1D6R)

Alabama is on the cusp of losing one of its seven seats in reapportionment. Sources suggest the final numbers are very close and the state may sue over how the figures are tabulated should apportionment take away one of the Republican seats. The Democrats have only one CD in the state, which is a majority minority seat (Rep. Terri Sewell-D) that is a certainty to remain as part of the delegation.

Should Alabama lose a seat in reapportionment, the state’s southeastern region, most particularly the Montgomery anchored 2nd District, would probably the most affected since this is the least populated area of the seven CDs.


• Delaware – 1 Seat (1D)

The home of new President Joe Biden was once a relatively conservative state, but no longer. Delaware is growing but won’t come anywhere near gaining a second seat. Therefore, three-term Rep. Lisa Blunt Rochester (D-Wilmington) will have an easy electoral ride for the foreseeable future.


• Florida – 27 Seats (11D16R)

The Sunshine State is one of two entities perched to gain multiple new districts. Florida is projected to add two seats, which should give the GOP map drawers the opportunity of protecting the newly won South Florida District 26 (Rep. Carlos Gimenez) and 27 (Rep. Maria Elvira Salazar) while maximizing the Republican compilation of Florida seats. Winning the aforementioned Miami-anchored CDs might result in conceding one of the new seats to the Democrats, however, in order to off-load a significant portion of their left-of-center voters, which would make both seats more Republican.

Holding the governor’s office, both houses of the legislature, and now a majority on the state Supreme Court will allow the GOP to become the big winner in redistricting. The fact that 25 of the 27 districts are over the estimated per district population projection of approximately 740,000 residents provides statistical evidence for expanding the delegation.

Rep. Darren Soto’s (D-Kissimmee) 9th District is the most over-populated seat with more than 931,000 people. Only Reps. Neal Dunn’s (R-Panama City) and Charlie Crist’s (D-St. Petersburg) seats are slightly below the projected population target. Twelve of the current 27 districts now hold more than 800,000 constituents. Expect the new seats to be added in South Florida, most likely toward the Gulf Coast side of the peninsula, and in the Orlando area.


• Georgia – 14 Seats (6D8R)

Though Republicans will control the redistricting pen as a result of holding both the legislature and governor’s office, the party map drawers will be hard-pressed to construct a map that allows their members to dominate the delegation as they did 10 years ago. Gaining a seat in 2010 reapportionment, the GOP began the decade with a 10-4 advantage in the House delegation only to see two Atlanta suburban seats slip away as a result of demographic and political changes in the metropolitan area.

Georgia is expected to remain constant in this reapportionment with their 14 seats. The GOP will attempt to make at least one of the seats they lost, District 6 (Rep. Lucy McBath) or District 7 (Rep. Carolyn Bourdeaux) more Republican and thus give themselves a chance to re-claim a seat for the coming decade.

Expect a move to make one of these two seats, probably District 6, more Democratic in order to make District 7 more Republican especially since the latter CD is the most over-populated seat in the state with more than 844,000 residents and will have to shed close to 90,000 individuals to other districts.
Continue reading

Comparing 2020 & 2016

By Jim Ellis

Jan. 15, 2021 — Now that the presidential numbers are final and certified in all 50 states, we can begin to draw comparisons between the two Trump election years and see the states where movement was most significant.

The 2020 election results show interesting parallels in the race between President Donald Trump and President-Elect Joe Biden and the 2016 race between Trump and Hillary Clinton.

A total of 158,507,118 people are recorded as voting in the 2020 election, an all-time record. In 2016, by comparison, 136,792,535 individuals cast ballots. The current total represents an increase of 15.9 percent. Even those forecasting a turnout of just above 155 million, which seemed outlandish at the time, were low as the 2020 aggregate final vote widely cleared all previous electoral participation records.

As you will see from the following charts, most states performed similarly in 2020 as they did in 2016. In the preponderance of places, both President Trump and President-Elect Joe Biden posted better percentages in 2020, though Trump recorded slightly lower 2020 percentages in 13 states as compared to Biden falling below 2016 Democratic nominee Hillary Clinton in only one (Mississippi).

The change factors are largely due to lesser independent and minor party candidates on the 2020 ballot as opposed to 2016 and an increase in first-time voters.

Nationally, as determined in all 50 states, President Trump’s numbers increased an average of one percentage point per state, while Biden saw a mean average four percent jump over Clinton’s standing.

The first charts depict President Trump’s state totals in alphabetical order. To reiterate, his per state average gain was 1.0 percent. The second chart shows the states in order of the largest gains.

The succeeding Democratic charts illustrate Biden’s increased performance over that of Clinton. Though his national per state victory margin over President Trump was low in comparison to 2016 – changing Arizona, Georgia, Wisconsin and the 2nd District of Nebraska would have changed the national outcome and the aggregate vote margin was only 65,009 – his standing in every state was significantly better than hers. The Biden average per state gain was 4.0 percent.

REPUBLICAN

Alphabetical

STATE 2016 R 2020 R AVG GAIN
Alabama 62.1% 62.3% 0.2%
Alaska 51.3% 52.8% 1.5%
Arizona 48.7% 49.1% 0.4%
Arkansas 60.6% 62.4% 1.8%
California 31.6% 34.3% 2.7%
Colorado 43.2% 41.9% -1.3%
Connecticut 40.9% 39.2% -1.7%
Delaware 41.7% 39.8% -1.9%
Florida 49.0% 51.2% 2.2%
Georgia 50.8% 49.2% -1.6%
Hawaii 29.4% 33.9% 4.5%
Idaho 59.3% 63.8% 4.5%
Illinois 38.8% 40.6% 1.8%
Indiana 56.9% 57.0% 0.1%
Iowa 51.2% 52.8% 1.6%
Kansas 56.6% 56.2% -0.4%
Kentucky 62.5% 62.1% -0.4%
Louisiana 58.1% 58.5% 0.4%
Maine 43.5% 43.6% 0.1%
Maryland 33.9% 32.2% -1.7%
Massachusetts 32.3% 39.1% 6.8%
Michigan 47.6% 47.8% 0.2%
Minnesota 44.9% 45.3% 0.4%
Mississippi 57.9% 41.1% -0.3%
Missouri 56.8% 56.8% 0.0%
Montana 56.2% 56.9% 0.7%
Nebraska 58.7% 58.2% -0.5%
Nevada 45.5% 47.8% 2.3%
New Hampshire 46.5% 45.4% -1.1%
New Jersey 41.4% 41.4% 0.0%
New Mexico 40.0% 43.5% 3.5%
New York 36.1% 37.5% 1.4%
North Carolina 49.8% 49.9% 0.1%
North Dakota 65.1% 31.8% 2.1%
Ohio 51.7% 53.3% 1.6%
Oklahoma 65.3% 65.4% 0.1%
Oregon 40.4% 56.5% 0.7%
Pennsylvania 48.6% 48.8% 0.2%
Rhode Island 38.9% 38.6% -0.3%
South Carolina 54.9% 55.1% 0.2%
South Dakota 61.5% 61.8% 0.3%
Tennessee 60.7% 60.7% 0.0%
Texas 53.2% 52.1% -1.1%
Utah 45.5% 58.1% 12.6%
Vermont 29.8% 30.9% 1.1%
Virginia 44.4% 44.0% -0.4%
Washington 36.8% 38.8% 2.0%
West Virginia 68.6% 68.7% 0.1%
Wisconsin 47.2% 48.8% 1.6%
Wyoming 67.4% 69.5% 2.1%

Performance Increase

STATE 2016 R 2020 R AVG GAIN
Utah 45.5% 58.1% 12.6%
Massachusetts 32.3% 39.1% 6.8%
Hawaii 29.4% 33.9% 4.5%
Idaho 59.3% 63.8% 4.5%
New Mexico 40.0% 43.5% 3.5%
California 31.6% 34.3% 2.7%
Nevada 45.5% 47.8% 2.3%
Florida 49.0% 51.2% 2.2%
North Dakota 65.1% 31.8% 2.1%
Wyoming 67.4% 69.5% 2.1%
Washington 36.8% 38.8% 2.0%
Arkansas 60.6% 62.4% 1.8%
Illinois 38.8% 40.6% 1.8%
Iowa 51.2% 52.8% 1.6%
Ohio 51.7% 53.3% 1.6%
Wisconsin 47.2% 48.8% 1.6%
Alaska 51.3% 52.8% 1.5%
New York 36.1% 37.5% 1.4%
Vermont 29.8% 30.9% 1.1%
Oregon 40.4% 56.5% 0.7%
Montana 56.2% 56.9% 0.7%
Arizona 48.7% 49.1% 0.4%
Louisiana 58.1% 58.5% 0.4%
Minnesota 44.9% 45.3% 0.4%
South Dakota 61.5% 61.8% 0.3%
Alabama 62.1% 62.3% 0.2%
Michigan 47.6% 47.8% 0.2%
Pennsylvania 48.6% 48.8% 0.2%
South Carolina 54.9% 55.1% 0.2%
Indiana 56.9% 57.0% 0.1%
Maine 43.5% 43.6% 0.1%
North Carolina 49.8% 49.9% 0.1%
Oklahoma 65.3% 65.4% 0.1%
West Virginia 68.6% 68.7% 0.1%
Missouri 56.8% 56.8% 0.0%
New Jersey 41.4% 41.4% 0.0%
Tennessee 60.7% 60.7% 0.0%
Mississippi 57.9% 41.1% -0.3%
Rhode Island 38.9% 38.6% -0.3%
Kansas 56.6% 56.2% -0.4%
Kentucky 62.5% 62.1% -0.4%
Virginia 44.4% 44.0% -0.4%
Nebraska 58.7% 58.2% -0.5%
New Hampshire 46.5% 45.4% -1.1%
Texas 53.2% 52.1% -1.1%
Colorado 43.2% 41.9% -1.3%
Georgia 50.8% 49.2% -1.6%
Connecticut 40.9% 39.2% -1.7%
Maryland 33.9% 32.2% -1.7%
Delaware 41.7% 39.8% -1.9%

DEMOCRAT

Alphabetical

STATE 2016 D 2020 D AVG GAIN
Alabama 34.4% 36.6% 2.2%
Alaska 36.5% 42.8% 6.3%
Arizona 45.1% 49.4% 4.3%
Arkansas 33.6% 34.8% 1.2%
California 61.7% 63.5% 1.8%
Colorado 48.2% 55.4% 7.2%
Connecticut 54.6% 59.2% 4.6%
Delaware 53.1% 58.7% 5.6%
Florida 47.8% 47.9% 0.1%
Georgia 45.6% 49.5% 3.9%
Hawaii 61.0% 63.1% 2.1%
Idaho 27.5% 33.1% 5.6%
Illinois 55.8% 57.5% 1.7%
Indiana 37.8% 41.0% 3.2%
Iowa 41.7% 3.2% 3.0%
Kansas 36.0% 41.6% 5.6%
Kentucky 32.7% 36.1% 3.4%
Louisiana 38.4% 39.8% 1.4%
Maine 46.4% 52.5% 6.1%
Maryland 60.3% 65.4% 5.1%
Massachusetts 59.0% 65.1% 6.1%
Michigan 47.3% 50.6% 3.3%
Minnesota 46.4% 52.4% 6.0%
Mississippi 57.6% 40.1% -1.0%
Missouri 38.1% 41.4% 3.3%
Montana 35.7% 40.6% 4.9%
Nebraska 33.7% 39.2% 5.5%
Nevada 47.9% 50.1% 2.2%
New Hampshire 46.8% 52.7% 5.9%
New Jersey 55.5% 57.3% 1.8%
New Mexico 48.3% 54.3% 6.0%
New York 58.4% 60.4% 2.0%
North Carolina 46.2% 48.6% 2.4%
North Dakota 63.0% 27.2% 4.6%
Ohio 43.6% 45.2% 1.6%
Oklahoma 28.9% 32.3% 3.4%
Oregon 39.1% 50.1% 6.4%
Pennsylvania 47.8% 50.0% 2.2%
Rhode Island 54.4% 59.4% 5.0%
South Carolina 40.7% 43.4% 2.7%
South Dakota 31.7% 35.6% 3.9%
Tennessee 34.7% 37.5% 2.8%
Texas 43.2% 46.5% 3.3%
Utah 27.5% 37.7% 10.2%
Vermont 55.7% 65.5% 9.8%
Virginia 49.7% 54.1% 4.4%
Washington 52.5% 58.0% 5.5%
West Virginia 26.5% 29.7% 3.2%
Wisconsin 46.5% 49.4% 2.9%
Wyoming 21.6% 26.4% 4.8%

Performance Increase

STATE 2016 D 2020 D AVG GAIN
Utah 27.5% 37.7% 10.2%
Vermont 55.7% 65.5% 9.8%
Colorado 48.2% 55.4% 7.2%
Oregon 39.1% 50.1% 6.4%
Alaska 36.5% 42.8% 6.3%
Massachusetts 59.0% 65.1% 6.1%
Maine 46.4% 52.5% 6.1%
New Mexico 48.3% 54.3% 6.0%
Minnesota 46.4% 52.4% 6.0%
New Hampshire 46.8% 52.7% 5.9%
Idaho 27.5% 33.1% 5.6%
Kansas 36.0% 41.6% 5.6%
Delaware 53.1% 58.7% 5.6%
Nebraska 33.7% 39.2% 5.5%
Washington 52.5% 58.0% 5.5%
Maryland 60.3% 65.4% 5.1%
Rhode Island 54.4% 59.4% 5.0%
Montana 35.7% 40.6% 4.9%
Wyoming 21.6% 26.4% 4.8%
North Dakota 63.0% 27.2% 4.6%
Connecticut 54.6% 59.2% 4.6%
Virginia 49.7% 54.1% 4.4%
Arizona 45.1% 49.4% 4.3%
Georgia 45.6% 49.5% 3.9%
South Dakota 31.7% 35.6% 3.9%
Oklahoma 28.9% 32.3% 3.4%
Kentucky 32.7% 36.1% 3.4%
Michigan 47.3% 50.6% 3.3%
Texas 43.2% 46.5% 3.3%
Missouri 38.1% 41.4% 3.3%
Indiana 37.8% 41.0% 3.2%
West Virginia 26.5% 29.7% 3.2%
Iowa 41.7% 44.7% 3.0%
Wisconsin 46.5% 49.4% 2.9%
Tennessee 34.7% 37.5% 2.8%
South Carolina 40.7% 43.4% 2.7%
North Carolina 46.2% 48.6% 2.4%
Alabama 34.4% 36.6% 2.2%
Nevada 47.9% 50.1% 2.2%
Pennsylvania 47.8% 50.0% 2.2%
Hawaii 61.0% 63.1% 2.1%
New York 58.4% 60.4% 2.0%
California 61.7% 63.5% 1.8%
New Jersey 55.5% 57.3% 1.8%
Illinois 55.8% 57.5% 1.7%
Ohio 43.6% 45.2% 1.6%
Louisiana 38.4% 39.8% 1.4%
Arkansas 33.6% 34.8% 1.2%
Florida 47.8% 47.9% 0.1%
Mississippi 57.6% 40.1% -1.0%