Tag Archives: Florida

Why Arizona is So Pivotal

By Jim Ellis

Does Arizona hold the key in a Trump-Biden election?

Sept. 16, 2020 — For several reasons, the Grand Canyon State of Arizona is possibly the most important state on the political map to determine the ultimate presidential election outcome.

Primarily, Arizona is one of five core states that President Trump must win to form a foundation for a favorable remaining state coalition map. The other four, geographically from west to east, are Texas, Georgia, Florida, and North Carolina. Should Joe Biden break through in any one of these five states, he will likely win the national election.

At this point, Arizona appears to be the most precarious of the Trump core states. While the President’s numbers are improving here, the September polls find him trailing Biden in all six publicly released surveys from a range of one to nine points among likely voters, with a mean average of Biden plus-4, and a median of Biden plus-3.5.

The five states are so critical to President Trump, or any Republican national candidate, because, as a unit, they yield a relatively easy remaining victory map. Carrying the five southern sector domains and assuming no leakage in Ohio or Iowa, and even while not winning Nevada or New Hampshire, the GOP nominee then claims the presidency with a victory in any one of the key Great Lakes states: Michigan, Minnesota, Pennsylvania, or Wisconsin. For a Democrat to win under this scenario, he or she would be forced to sweep the aforementioned quartet.

President Trump won the 2016 Electoral College vote 306-232, which means he can relinquish a net 36 electoral votes in 2020 and still win the national election. Under the scenario of him taking either Wisconsin or Minnesota, along with keeping Arizona, he would defeat Biden with exactly 270 electoral votes. This model also assumes he wins the 2nd Congressional District from both Nebraska and Maine, the two states that split their electoral votes. He won both in 2016. Under this scenario, Michigan and Pennsylvania would go to Biden.

Arizona, now potentially teetering toward the Democrats, is critical to the president’s prospects because Trump cannot afford to trade it for one of the western Great Lakes States, either Minnesota or Wisconsin. Such a loss would force the president to win two of the four Great Lakes, but only one could be Minnesota or Wisconsin since those two states have 10 electoral votes and Arizona has 11.

Therefore, simply put, losing Arizona because of its 11th electoral vote would mean that Trump would be forced to carry either Michigan or Pennsylvania in addition to one of the other three remaining Great Lakes States. A further scenario involving Trump losing Arizona and replacing it with both of the 10-electoral vote states (MN and WI) could result in the election ending in a 269-269 tie. This would force a tiebreaker to be decided in the US House of Representatives.

Let’s look at the chances of Trump winning Arizona by comparing his current standing to where he was at this point in 2016. Looking at the Real Clear Politics polling archives, we find that 19 Arizona polls were conducted during the entire 2016 election cycle. In 2020, just since the July 4th holiday break, 25 surveys were publicly reported in the Grand Canyon State.

Four years ago, at the end of August through mid-September, two individual polls came from Gravis Marketing (Aug. 25-27, 2016) and NBC News/Marist College (Sept. 6-8, 2016). These surveys yielded Trump four and one-point leads, respectively. Shortly thereafter, the trend began to turn Hillary Clinton’s way. The OH Predictive Insights survey (Sept. 28-30, 2016) found the two candidates tied at 42 percent apiece, while Emerson College (Oct. 2-4, 2016) and the Arizona Republic newspaper poll (Oct. 10-15, 2016) detected consecutive leads for Clinton of two and five points.

Therefore, Arizona did not turn toward Trump for good until the Monmouth University survey in late October (Oct. 21-24, 2016), which put him just one point ahead. Going into the election from that point, and remembering the 2016 election was on Nov. 8, Trump led in the final four polls from a two to five-point margin. He would eventually win the actual vote count by 3.6 percentage points, 48.7 – 45.1 percent, meaning a raw vote margin of 91,234 votes of more than 2.573 million ballots cast.

Because of Arizona’s fast population growth, the state has changed in four years. During that interval, the overall population expanded five percentage points to 7,278,717 individuals according to the Census Bureau’s July 2019 estimate, the latest available.

Minorities, specifically Hispanics and blacks, account for approximately 69 percent of the population gain, thus at least partially explaining Biden’s improved prospects in the state. Overall, Hispanics represent 31.7 percent of the overall Arizona population, and blacks 5.2 percent, as compared to the non-Hispanic white position receding to 54.1 percent.

The population changes suggest that this already tight political state will likely become even closer as we head for Nov. 3.
Presidential Polling Progress

By Jim Ellis

Aug. 27, 2020 — The Republican National Convention coverage featured several mentions of swing state polling getting closer between the two presidential candidates, and recent moves from both sides would seem to suggest that internal survey numbers also reflect such a trend.

Below, we compare the 10 most recent polls with the 10 prior surveys in each of the key states to better illustrate the campaign’s movement:


ARIZONA

Last 10 Public Polls: July 17 – August 23
• Biden Aggregate Average Lead: 3.2%

Previous 10 Public Polls: June 26 – July 24
• Biden Aggregate Average Lead: 4.4%

Swing: Trump +1.2%


FLORIDA

Last 10 Public Polls: July 17 – August 22
• Biden Aggregate Average Lead: 3.2%

Previous 10 Public Polls: June 8 – July 21
• Biden Aggregate Average Lead: 6.9%

Swing: Trump +3.7%


GEORGIA

Last 10 Public Polls: July 9 – August 15
• Trump Aggregate Average Lead: 0.4%

Previous 10 Public Polls: May 4 – July 2
• Trump Aggregate Average Lead: 0.1%

Swing: Trump +0.3%


MICHIGAN

Last 10 Public Polls: July 24 – August 23
• Biden Aggregate Average Lead: 7.0%

Previous 10 Public Polls: July 9 – July 26
• Biden Aggregate Average Lead: 7.4%

Swing: Trump +0.4%


Continue reading

Eight Men Out

By Jim Ellis

Poster for the movie, “Eight Men Out”

Aug. 20, 2020 — The 1988 movie “Eight Men Out” about the 1919 baseball World Series carries a title that also aptly describes the 2020 congressional primary season. At this early point in the voting cycle, already eight US House members have been denied re-nomination, which will oust them from office — a large number when comparing to typical campaign years.

It’s worth noting these results because the incumbent defeats are geographically widespread and not confined to one party. Of the eight, five are Republicans, three are Democrats, and each come from different states.

Looking at the eight campaigns, however, only two reasons largely explain the incumbent losses within the respective intra-party elections: ideology and ethics.

Florida Freshman Rep. Ross Spano (R-Dover) from his Lakeland-anchored district this past Tuesday is the latest to lose. The others are, chronologically from the beginning: Reps. Dan Lipinski (D-IL), Steve King (R-IA), Denver Riggleman (R-VA), Eliot Engel (D-NY), Scott Tipton (R-CO), Steve Watkins (R-KS), Lacy Clay (D-MO), and Spano.

In each case, the Democratic losses are ideologically driven. In Illinois, New York, and Missouri, veteran Democrats lost their seats to challengers from the far left, all backed by the Justice Democrats PAC that is loosely associated with New York Rep. Alexandria Ocasio-Cortez. The insurgent campaign strategy in each case was to cast the incumbent as not being sufficiently progressive in addition to more specific attacks.

In Illinois back in March, media consultant Marie Newman returned to again challenge Rep. Lipinski after losing to him 51-49 percent in the 2018 Democratic primary. Rep. Lipinski, an eight-term Chicago suburban congressional veteran whose father held the seat for 22 years before him, had established a moderate record — yet even moving left for the current term couldn’t stop the coming trend. Turnout increased 16 percent when compared to the 2018 primary, and Newman flipped a 49-51 percent loss into a 47-45 percent victory.

Eliot Engel represented the Bronx in Congress for what will be 32 years after serving for 12 years in the New York State Assembly. Aided by Engel campaign mistakes, middle school principal Jamaal Bowman swept to victory with strong assistance from the Justice Democrats. The key themes here were Engel losing touch with his constituents and being out of step with today’s Democratic Party.

Continue reading

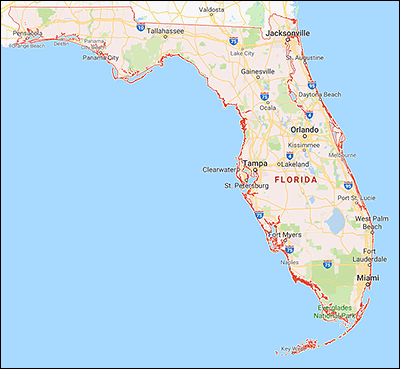
Florida Primary Preview

By Jim Ellis

Aug. 18, 2020 — The largest of the states hosting a primary today, Florida joins Alaska and Wyoming in holding their nominating elections. With no Senate or governor campaign on the Florida ballot this year, we look to the 27 US House districts. Of those, we see action in eight CDs today, with two of them almost assuredly choosing congressional successors in two open Republican districts.


FL-3

In the northern Florida 3rd District, Rep. Ted Yoho (R-Gainesville) is serving his fourth and final term in the House. Back in 2012, he pledged to serve no more than four terms to coincide with the state’s “Eight is Enough” (meaning years in office) term limit law for state legislative candidates.

This race could be a free-for-all finish tonight among the 10 Republican candidates in this 56-40 percent Trump ’16 district, as raised money is relatively evenly distributed among the top four candidates. Dr. James St. George, however, has added $600,000 of his own funds to the race.

The other top candidates appear to be businessman and former congressional staffer Judson Sapp, who has many endorsements from the Florida delegation, former Gainesville City commissioner Todd Chase, and an ex-Yoho House staff member, Kat Cammack. Tonight’s winner virtually punches his or her ticket to the succeeding Congress in January.


FL-19

The other open seat comes in southwest Florida, where two-term Rep. Francis Rooney (R-Naples/Ft. Myers) is retiring. This is another multi-candidate Republican primary for a seat that is even safer than the aforementioned Yoho district (Trump ’16: 60-37 percent).

This contest has a combination of wealthy self-funders, Marine Corps veteran and businessman Casey Askar who has invested over $3 million into his campaign, and local physician William Figlesthaler who has added $2 million of his own funds. Following are two local officeholders, state House Majority Leader Dane Eagle (R-Cape Coral), and state Rep. Byron Donalds (R-Naples). These four appear to be the top candidates, one of whom will prevail tonight and head to Washington as a member of the new House of Representatives.


FL-15

The other major attraction tonight is in the state’s 15th District, anchored in the city of Lakeland. Here, freshman Rep. Ross Spano (R-Dover) has been under investigation for accepting improper loans to his 2018 campaign. The controversy was one major reason that Lakeland City Commissioner Scott Franklin (R) joined the race.

Continue reading

Three States Vote Tomorrow

By Jim Ellis

Aug. 17, 2020 — August primary season continues tomorrow with nomination elections occurring in Alaska, Florida, and Wyoming. Today, we cover Alaska and Wyoming. Tomorrow, we look at all the races in Florida.


ALASKA

The Alaska primary is not a major event because the general elections are basically set. Here, Independent candidates have the option of coalescing with a major party, which has a major effect upon the state’s politics. This Independent/Democrat situation is likely to occur in the Senate race, as favored candidate Al Gross, an Anchorage surgeon, will run as an Independent but coalesce with the Democrats. Therefore, regardless of what happens in tomorrow’s primary, Dr. Gross is likely to have ballot position in the general election.

Sen. Dan Sullivan (R) is seeking a second term. Several early polls found a tight race, but the latest survey, from the Alaska Survey Research firm (June 23-July 7; 66 likely Alaska voters), found the senator running ahead of Dr. Gross by 13 percentage points, 53-40 percent. At a commensurate time, Public Policy Polling (July 7-8; 1,081 Alaska voters via automated response device) found a five-point spread, with Sen. Sullivan holding only a 39-34 percent edge.

The latter PPP poll is suspect because Sen. Sullivan, as an incumbent, has an abnormally low ballot test standing, especially when comparing it to the Alaska Survey Research data. Additionally, when asked about President Trump’s job approval, the nation’s chief executive scored a 46:49 percent favorable to unfavorable rating. Also asked of Sen. Lisa Murkowski (R), her ratio was a surprisingly poor 29:55 percent. Yet, when asked whether the respondents have a higher opinion of President Trump or Sen. Murkowski, by an inconsistent 48-45 percent, the sampling universe answered Sen. Murkowski.

Sen. Sullivan remains a favorite for re-election, but this race could develop and become of some interest. It is a sleeper race for the Democrats that could come home if a political tsunami forms.

At-large Rep. Don Young (R-Ft. Yukon), the Dean of the House who was originally elected in a 1973 special election, seeks a 25th term and can expect another competitive race. Should Rep. Young be re-elected he will have served a total of 50 years in the House upon completing the succeeding term. That would still place him almost a decade behind the all-time seniority leader, the late Rep. John Dingell (D-MI) who served 59 years.

Continue reading

The Polling Extremes

By Jim Ellis

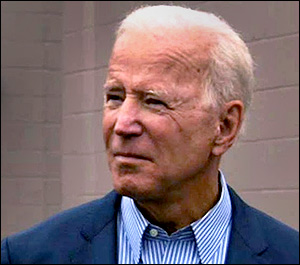
Former vice president and 2020 presidential candidate, Joe Biden (D)

July 31, 2020 — Two survey research organizations, Morning Consult and Change Research, just released the results of their recent battleground states polling series. Looking at all the recent public data in these places illustrates the polling volatility and movement within the states that will ultimately decide the presidential election.

The ballot test results listed for each state below illustrates the most extreme examples for President Trump and former vice president Joe Biden during the mid to late July period. With such a wide variance in most places, it is difficult to say with any certainty exactly how these defining states will actually perform come Election Day.

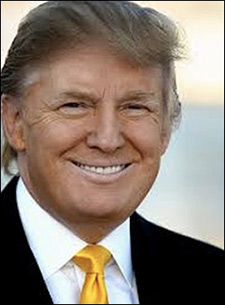
President Donald Trump

It is also important to take into account sample size, sample segmentation, and whether the poll was conducted through live interview, online questioning, or an interactive voice response system.


ARIZONA
• Morning Consult (JULY 17-26, 908 likely Arizona voters)
Joe Biden (D) ………….. 49% (+7)
Donald Trump (R) ……. 42%
• Change Research (July 24-26, 365 likely Arizona voters; targeted online sample)
Joe Biden (D) ………….. 47% (+2)
Donald Trump (R) ……. 45%

Arizona surveys have consistently yielded small leads for Biden over the past several months. Most of the recent results find the candidates falling within the polling margin of error.


FLORIDA
• Morning Consult (July 17-26, 3,593 likely Florida voters; online)
Donald Trump (R) ……. 48% (+1)
Joe Biden (D) ………….. 47%
• Quinnipiac University (July 16-20, 924 registered Florida voters; live interview)
Joe Biden (D) ………….. 51% (+13)
Donald Trump (R) ……. 38%

This is the most divergent spread within all of the battleground states. Florida’s polling history has routinely featured wide polling ranges that result in close election results.
Continue reading

The Wild Polling Spectrum

By Jim Ellis

July 27, 2020 — We’ve seen a plethora of presidential state polls released in the past couple of days, and the results seem to swing wildly among the various pollsters. While most studies have shown former vice president Joe Biden at present winning most of the key states, his margins don’t seem particularly secure even while his national numbers appear stronger.

Let’s explore the polling divergence, and remember that sample selection, weighting, size of the respondent universe, and length of time to complete the survey process are all important variables in determining a ballot test result. Also, the huge number of people refusing to answer their phones or not participating in political surveys means that pollsters must further rely on weighting and mathematical supposition to compensate for the lack of live responses.

With that short background, let’s look at some of the key states producing the widest swings:


FLORIDA

• Quinnipiac University – July 16-20 (924 registered voters; live interview)

Biden 51
Trump 38
Biden plus 13

• St. Pete Polls – July 13-14 (3,018 likely voters via automated system)

Biden 50
Trump 44
Biden plus 6

Though Biden is up in both polls, the margin difference is stark. The Q-Poll, brandishing such a wide spread in what is typically a close political state raises reliability questions.


GEORGIA

• Garin Hart Yang Research – July 9-15 (800 likely voters)

Biden 47
Trump 43
Biden plus 4

• Spry Strategies – July 11-16 (701 likely voters; IVR)

Trump 49
Biden 46
Trump plus 3

Here we see two different leaders within two different polling samples within the same virtual period. Republicans tend to under-poll in the southern states, which could certainly be present in at least the GHY poll.


Continue reading

Turnout 2020: Up, then Down

By Jim Ellis

June 8, 2020 — In most political campaigns, the final electoral result is determined not necessarily from transforming undecided individuals into positive votes, but rather ensuring that the candidate’s committed supporters actually cast their ballot. Therefore, accurately projecting and influencing voter turnout becomes critical for every campaign.

Before the COVID-19 virus struck, many analysts and political prognosticators were predicting a record turnout in the 2020 general election, thus exceeding 2016’s all-time high 136.8 million presidential election ballots. Many stated that breaking 150 million voters was possible, with some even believing that was likely. The post-COVID primary vote participation figures now suggest otherwise, however.

There is a big difference in voter turnout before and after the COVID-19 virus attack. Prior to the March 18 societal shutdown, 25 states had held presidential primary or major caucus elections, meaning up to and including the March 17 election date in Arizona, Florida, and Illinois. North Dakota and Wyoming, because of the small attendance figures in their caucuses and reporting system, are not included in this matrix.

By mid-March, former vice president Joe Biden had broken away from the pack of Democratic candidates, and all of his major opponents had either dropped out of the race or were headed down that path. When voters cast their ballots on March 17, only Sen. Bernie Sanders (I-VT) and Rep. Tulsi Gabbard (D-HI) were advancing to the April 7 primary in Wisconsin.

Through March 17, Democratic primary turnout was up substantially from 2016, and on projected pace to meet the high turnout general election predictions if such a trend continued throughout the remainder of the election year. Republican turnout was down substantially in comparison to 2016, but that is obviously because President Trump had no serious opposition for re-nomination. Therefore, only the Democratic turnout numbers are viable for making statistically relevant calculations and projections.

Through the 25 tested presidential primaries ending March 17, turnout was up 14.8 percent when compared to the open race four years ago in the 17 states that held primary or major caucus elections in both 2016 and 2020. Since the COVID shutdown, however, Democratic voter participation has fallen. In the 11 post-COVID states that held Democratic primary elections in both 2016 and 2020, turnout dropped 21.2 percent when comparing the participation figures from the aforementioned election years.

Continue reading

Nevada: A Target?

By Jim Ellis

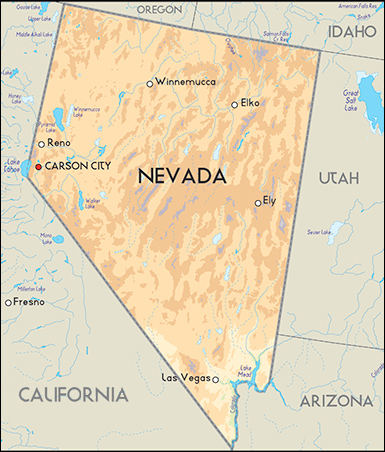
May 8, 2020 — The Silver State of Nevada, with six Electoral College votes, has been regarded as a swing state in most 21st Century presidential elections, but in projecting the 2020 vote, it is routinely considered as a place destined to land in the Democratic column. But, could Nevada ultimately be in play for President Trump?

With a general election electoral vote map looking ever closer as we move toward November, introducing a new target could drastically change the eventual outcome or at least the campaign focus and strategy.

A new ALG Research poll (April 27-30; 76 likely Nevada general election voters) reports findings that are consistent with virtually all of the 2016 Nevada general election surveys. Last week, the firm found former vice president Joe Biden leading President Trump with a 49-45 percent spread. Such a margin and preference percentages fall into the same realm as all 31 polls conducted in Nevada from May through the November 2016 election.

When ‘16 ended, Hillary Clinton carried the state, but her margin was only 2.4 percentage points, meaning a 27,000-vote spread of more than 1.12 million ballots cast. And, consistent with the large number of polls that concluded a close race within the 40s would be the actual result, Clinton defeated Trump, 47.9 – 45.4 percent, validating the plethora of research conducted over the final five-plus months of that election cycle.

Four years ago, 13 different pollsters conducted the almost three dozen surveys, and in no instance did either Trump or Clinton ever reach the 50 percent plateau. On the other end of the spectrum, in just three instances did one of the candidates dip below 40 percent. Therefore, in 28 of the 31 studies logged within the 2016 Real Clear Politics polling archives, both candidates fell within the 40s, meaning this result occurred over 90 percent of the time. In terms of range, the span stretched from Clinton plus-7 to Trump plus-6, but the average between the two was only 2.7 percent, which is almost exactly the actual final total. This obviously suggests a competitive political battlefield.

Continue reading

COVID & Redistricting

By Jim Ellis

April 29, 2020 — The deadline for the Census Bureau to release the new population data is March 31, 2021, but with the entire process being delayed due to COVID-19 precautions, the ability to meet the requirement is becoming more difficult by the day. Already, the Bureau has been delayed in dispatching their door-to-door teams necessary in obtaining the responses from people who did not return their mail tabulation form.

The Trump Administration is reportedly suggesting that the March 31 deadline be postponed to sometime in the summer of 2021. If this happens, we will see a series of redistricting problems ignited in the states. First, the political leaders in New Jersey and Virginia, places that have 2021 elections and need their new state legislative lines in place well before that date, would find themselves in a difficult position.

Initially, the two states would certainly have to postpone their primary elections because both nominate their general election candidates in June. Beyond that, it is possible they would have to even postpone their general elections into 2020 or run in the obsolete boundaries that were drawn back in 2011. In either case, we could expect lawsuits being launched from whichever party loses a particular electoral contest.

Other states would be affected, too. Many have legal deadlines in place mandating that the new redistricting maps for state legislature and the US House delegation be adopted before the legislative sessions ends. Most states recess before mid-summer, which would mean special sessions being called if the legislature is to act.

The problem intensifies in the states that are either gaining or losing congressional districts in reapportionment. Currently, it appears that seven states will add seats to their delegations (the best projections suggest that Texas will gain three, Florida two, and Arizona, Colorado, Montana, North Carolina, and Oregon one apiece), while 10 will lose single districts (Alabama, California [for the first time in history], Illinois, Michigan, Minnesota, New York, Ohio, Pennsylvania, Rhode Island, and West Virginia).

The aforementioned apportionment is based upon calculations released publicly and not, of course, using the actual numbers. Therefore, we could see some differences between these projections and what the formulas actually produce when the Census Bureau finally can produce the updated real figures.

Continue reading