Tag Archives: ALG Research

Polling Acceptability Standards Measured Across States

By Jim Ellis

April 15, 2021 — Five key Democratic pollsters recently released a report from a post-election meeting held to determine why their 2020 survey results again so often fell below acceptable accuracy standards.

Go to Democracy Docket to see all results by clicking on image above.

Representatives from the Democratic polling firms of ALG Research, Garin-Hart-Yang Research Group, GBAO Strategies, Global Strategy Group, and the Normington Petts firm met to develop a plan to correct some of their methodological flaws in order to provide more accurate information to their clients and the public in future elections.

Their key conclusion was that, generally, the polling community failed to accurately depict enough conservative/right-of-center vote coming from rural areas. They make the point that in politically changing places like Arizona and Georgia, the aggregate data was quite accurate, but they collectively missed in more rural Republican-leaning states such as Iowa.

While the polling firm reps stressed the point that their collective numbers were strong in the metropolitan areas, there seems to be, however, a further detail left unsaid or possibly unnoticed. That is, the polling community seemed to correctly project the outcomes in states that have one large central metropolitan area that is self-contained within a single media market such as Arizona (Maricopa County), Colorado (Denver Metro), Georgia (Atlanta Metro), and Nevada (Clark County), but not in states with diverse geographical configurations.

While the firms tended to miss by relatively large margins in rural states like Montana, and particularly so in that state’s Senate race, they also seemed to fare poorly in places where the population is more evenly spread and have several metropolitan areas. States in this category include several in the Midwest such as Ohio, Michigan, and Wisconsin, along with Florida, a major Sun Belt state.

In the latter place, while the polling was relatively accurate from a margin perspective, the aggregate polling community has consistently missed projecting the main Florida statewide winner(s) in every election since 2014. In each case, Democrats were predicted to win with a close margin while in actuality the Republican candidates claimed the election.

The charts below detail the states hosting the most competitive races and present the mean average polling during 2020 campaign’s final week. This average is then compared with the state’s final results. Notice that in places such as Michigan and Pennsylvania, culling the Democratic research firms from both the Republicans and the local pollsters – the latter of which in many places performed better than the national firms, i.e., in Maine, Iowa, and Kansas – drastically changes the average.

The Democratic pollsters’ meeting primarily revolved around presidential polling because of their uniform belief that former President Donald Trump had such a strong effect, both positive and negative, upon the electorate.

The Senate contests, however, contained some of the bigger polling misses. The most egregious is Maine, where the last week polling average showed Sen. Susan Collins (R) trailing by 5.7 percentage points when she would prove victorious with an 8.6% margin. Once more, we see a big miss in a largely rural state.

Continue reading

NC: First Post-Sexting Poll

By Jim Ellis

North Carolina Democratic Senate candidate Cal Cunningham’s recent involvement in a sexting scandal has seen polling numbers drop.

Oct. 7, 2020 — On Friday, it came to light, after the announcement that North Carolina Republican Sen. Thom Tillis had been diagnosed with COVID-19, that Democratic nominee Cal Cunningham who has been leading for most of the race is involved in a sexting affair with a married woman. The story was carried heavily in media reports on Friday.

Almost immediately, Public Policy Polling went into the field to assess the damage, and while they find Cunningham still holding the advantage it is half the size of the double-digit margin he enjoyed in the previous two surveys.

The North Carolina Senate race has been heavily studied. Just since Sept. 15, we have seen no less than 13 polls released of this Senate contest with Cunningham leading in all.

The new Public Policy Polling survey (Oct. 4-5; 911 North Carolina voters via interactive voice response system) sees Cunningham holding a 48-42 percent lead over Sen. Tillis. Though the margin is six points, the spread is down significantly from the 13- and 12-point advantages he recorded in the two most recent polls from Hart Research Associates (Sept. 24-27; 400 likely North Carolina voters via live interview) and ALG Research (Sept. 22-28; 822 voters, online), respectively.

The PPP data reveals that Cunningham is taking a hit over the budding scandal. When asked whether “the information about Cal Cunningham having a relationship with a woman who is not his wife make you more or less likely to vote for him, or does it not make a difference,” 37 percent answered they are less likely to support him versus three percent who said they were more inclined. A total of 58 percent said the breaking story would make no difference in how they decide to vote.

Continue reading

Sen. Lindsey Graham’s Challenge

By Jim Ellis

Is incumbent Sen. Lindsey Graham (R-SC) in re-election trouble?

Sept. 18, 2020 — Quinnipiac University surveyed the South Carolina political situation as part of their three-state polling series, which again produces some eyebrow-raising data. The results help identify why Sen. Lindsey Graham, a Republican senator from a Republican state, finds himself languishing in a competitive contest.

The poll (Sept. 10-14; 969 likely South Carolina voters, live interview conducted by the RDD firm for Quinnipiac) tested both the presidential and Senate campaigns. President Trump leads former vice president Joe Biden 51-45 percent in a ballot test that seems to be an under-count when looking at the survey’s supporting numbers. Sen. Graham, however, falls into a tie with opponent Jaime Harrison, at 48-48 percent, in a result that the underlying responses do seem to support.

President Trump’s six-point lead appears low because he tops Biden on virtually every personal and issue question. The Trump favorability index is 51:45 percent positive to negative, but the Biden ratio is much worse at 43:50 percent. The generic Republican-Democrat number falls 52-44 percent in favor of the GOP label.

Despite poor coronavirus management numbers for the president nationally, this South Carolina survey returns a 49:48 percent approval number on his handling of the issue. Furthermore, the respondents, in a 50-46 percent break, believe President Trump would do a better job handling coronavirus in the future than Biden. Not a particularly strong performance in this issue area, but better for the President than in almost any other place.

Trump also scores better in his handling of the economy (55-40 percent), the military (54-42 percent), and “keeping your family safe” (52-43 percent). Biden is favored, and only barely, 48-46 percent, on just one issue: racial equality.

Most importantly, the issue matrix sets up perfectly for Trump. The top two issues, according to these respondents, are the ones upon which the president is basing his campaign, law and order (23 percent) and bringing back the economy (22 percent). The Biden key issues rate rather poorly: coronavirus (12 percent), racial equality (12 percent), and healthcare (10 percent).

All of these underlying numbers suggest the Trump ballot test margin should be stronger than six points, which could be a signal that there is a “shy Trump voter factor” even in what is typically a safe Republican state. The “shy Trump voter” is the phrase now used to describe the individual who only secretly favors the president.

Continue reading

Beneath the Numbers

By Jim Ellis

Is Maine Sen. Susan Collins (R) in trouble?

July 30, 2020 — Two Senate polls were released earlier this week, and though the ballot tests in Maine and South Carolina didn’t show us anything particularly new, the pollsters asked their respective sampling universes some interesting ancillary questions.

Colby College, a Waterville, Maine institution housing approximately 1,800 students, released its second political poll of 2020 in conjunction with the McVey Data Science Initiative. The questions touched upon the presidential and Senate ballot tests but delved deeper into the attitudes and perspectives of their 888-person sample over the July 18-24 period.

The presidential ballot test found former vice president Joe Biden leading President Trump statewide, 50-38 percent. The Senate ballot test was closer in that former state House speaker Sara Gideon (D) leads Sen. Susan Collins (R), 44-39 percent.

In looking deeper, it is probable that the actual race standings are likely a bit closer. There appears to be a Democratic skew in that all favorability indexes for Democratic public officials were positive and those of the tested Republican officials were decidedly negative. Additionally, 52 percent of the sampling universe comes from the state’s southern congressional district, the 1st, which is decidedly more liberal than the northern 2nd District. Together, these factors provide us the indication that the results are a few points more favorable for Democrats than what we might see in actual voting.

Continue reading

Nevada: A Target?

By Jim Ellis

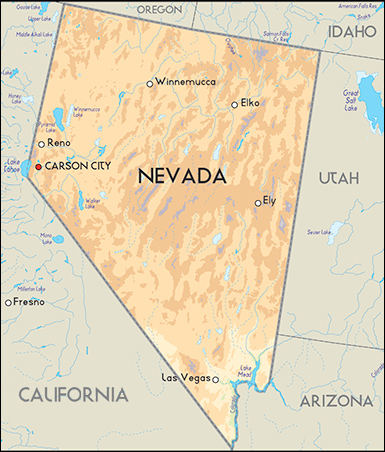
May 8, 2020 — The Silver State of Nevada, with six Electoral College votes, has been regarded as a swing state in most 21st Century presidential elections, but in projecting the 2020 vote, it is routinely considered as a place destined to land in the Democratic column. But, could Nevada ultimately be in play for President Trump?

With a general election electoral vote map looking ever closer as we move toward November, introducing a new target could drastically change the eventual outcome or at least the campaign focus and strategy.

A new ALG Research poll (April 27-30; 76 likely Nevada general election voters) reports findings that are consistent with virtually all of the 2016 Nevada general election surveys. Last week, the firm found former vice president Joe Biden leading President Trump with a 49-45 percent spread. Such a margin and preference percentages fall into the same realm as all 31 polls conducted in Nevada from May through the November 2016 election.

When ‘16 ended, Hillary Clinton carried the state, but her margin was only 2.4 percentage points, meaning a 27,000-vote spread of more than 1.12 million ballots cast. And, consistent with the large number of polls that concluded a close race within the 40s would be the actual result, Clinton defeated Trump, 47.9 – 45.4 percent, validating the plethora of research conducted over the final five-plus months of that election cycle.

Four years ago, 13 different pollsters conducted the almost three dozen surveys, and in no instance did either Trump or Clinton ever reach the 50 percent plateau. On the other end of the spectrum, in just three instances did one of the candidates dip below 40 percent. Therefore, in 28 of the 31 studies logged within the 2016 Real Clear Politics polling archives, both candidates fell within the 40s, meaning this result occurred over 90 percent of the time. In terms of range, the span stretched from Clinton plus-7 to Trump plus-6, but the average between the two was only 2.7 percent, which is almost exactly the actual final total. This obviously suggests a competitive political battlefield.

Continue reading