Tag Archives: Real Clear Politics

Florida Polling – What to Expect

By Jim Ellis

Aug. 20, 2021 — Two pollsters released Florida ballot test data yesterday, and the combined results are a likely prelude of what we can expect from the vast multitude of survey research firms that will be testing the Sen. Marco Rubio – Rep. Val Demings general election campaign in the coming year.

Florida Sen. Marco Rubio (R)

Susquehanna Polling & Research (Aug. 4-10; 700 registered Florida voters, live interview) posted their survey result, which found Sen. Rubio topping Rep. Demings by a relatively substantial 50-39 percent clip.

This was immediately countered by a St. Pete Polls survey conducted later in the month (Aug. 16-17; 2,068 registered Florida voters, online) that sees the race already dropping into a virtual dead heat, with Sen. Rubio only holding a two-point edge, 48-46 percent.

Florida polling history suggests we will see this type of divergent pattern among pollsters probably until the next election. In Sen. Rubio’s 2016 re-election race, for example, where he defeated then-Rep. Patrick Murphy (D) with an eight-point victory spread (52-44 percent), most of the pollsters were forecasting a much closer finish.

During the period from Oct. 25 through election day 2016, 11 polls were released covering the Rubio-Murphy race according to the Real Clear Politics polling archives, and while all but one correctly predicted Sen. Rubio would win re-election, only five were within the correct final margin range. The others were forecasting a very close Rubio win of between a virtual tie and four percentage points.

Looking at the Biden-Trump 2020 Florida aggregate research studies tells a similar tale. Again, beginning with polling occurring from Oct. 25 through the election, 19 Florida presidential ballot test polls were published. Only six of the 19 correctly predicted a Trump Florida victory and all of those were close to the final margin of 3.3 percentage points. One of the pollsters who called this race almost exactly was Susquehanna Polling & Research. St. Pete Polls missed, wrongly projecting a close Biden win.

Looking at the FiveThirtyEight statistical organization’s polling firms rating chart, Susquehanna and St. Pete Polls are at parity. Susquehanna rates as the 92nd firm of the top 100, while St. Pete finishes three slots behind them at number 95. Both receive an accuracy letter grade of B+.

Continue reading

Final House Tally: 223-212?

By Jim Ellis

Dec. 1, 2020 — The latest outstanding congressional race numbers suggest that the House may break 223 Democrats to 212 Republicans when some very close elections are finally decided. If this is indeed the final party division among the 435 seats, the GOP will only be six congressional districts away from re-claiming the House majority in the 2022 elections.

Currently, we see Real Clear Politics projecting California Rep. Mike Garcia (R-Santa Clarita) as the winner over state Assemblywoman Christy Smith (D-Newhall) in the state’s 25th CD, which lies in parts of both Los Angeles and Ventura Counties.

With still a small undetermined number of votes to be verified and counted, Garcia’s tight 405-vote margin appears to be holding. Our own rudimentary projections suggest that the freshman Republican congressman will hold by just under 400 votes. It is probable we will see a recount and potential ballot challenges, so the result may be challenged before and after certification. Under California election law, certification for all races must occur by Dec. 11.

We have seen several projections made suggesting former California Rep. David Valadao (R-Hanford) has defeated freshman Rep. T.J. Cox (D-Fresno) in the state’s Central Valley 21st CD. Valadao has a 1,820-vote lead according to the California Target Book organization’s in-depth analysis.

Our more rudimentary estimates suggest that Valadao will win the final count by approximately 1,400 votes based upon the potential number of outstanding ballots in the three counties, Kern, Kings, and Tulare, that are still verifying and counting mail votes. Fresno County has completed its count.

Later today, we expect to see the second certification of Iowa candidate Mariannette Miller-Meeks (R) in the state’s 2nd Congressional District. Under Iowa law, a certification had to be issued one week after the election, in this case Nov. 10, and Miller-Meeks, a state senator from Ottumwa who is in her fourth run for the US House, was originally certified as the winner with a 47-vote margin. The full recount finds former state senator and 2018 lieutenant governor nominee Rita Hart (D) gaining votes but still losing by a total of just six votes districtwide from more than 394,400 ballots cast, a Miller-Meeks winning percentage of 50.0008 percent.

Continue reading

It’s Now Down to Three

By Jim Ellis

David Valadao (R)

Nov. 24, 2020 — Unofficial victory projections are being made for California’s 21st Congressional District in favor of Republican former Rep. David Valadao (R-Hanford). It is becoming clearer as more mail votes are being counted and the pool of remaining ballots diminishes to under 10,000, that Valadao has defeated freshman Rep. T.J. Cox (D-Fresno) in one of the few remaining undetermined congressional campaigns.

Real Clear Politics, the Cook Political Report, and the local Fresno Bee newspaper are all reporting that Valadao has won the race, though the former Congressman himself has yet to declare victory and Cox has not conceded defeat.

Valadao, who previously served three terms in the House after his original election in 2012 before losing to Rep. Cox in a tight 862-vote margin two years ago, currently leads the 2020 outcome by 1,618 tabulations.

Cox has attracted 58.5 percent of the vote in Kern County, the district’s largest population entity, but with approximately 9,000-11,000 votes remaining at most even such a large percentage will likely leave him over 1,000 tallies short of Valadao’s total. Over 1,500 votes remain in Kings County, in which the Republican recorded 62.1 percent support. Tulare County, which finds only eight percent of the voting population contained within the congressional district, split almost evenly between the two men as Cox leads there by just 21 votes. Fresno County has fully reported.

The Valadao victory means the Republicans have now gained a net 10 seats with three races remaining outstanding. A fourth undetermined race, that in Louisiana’s 5th CD, is going to a post-election runoff on Dec. 5. While the winning candidate is yet unidentified, the secondary election is between two Republican candidates, former congressional aide Luke Letlow and state Rep. Lance Harris (R-Alexandria), so the GOP is assured of holding the seat.

Also, in California, freshman Rep. Mike Garcia (R-Santa Clarita) is claiming to have won the north Los Angeles/Ventura County 25th District. Though only leading by exactly 400 votes with what looks to be in the neighborhood of 4,500 ballots waiting for verification and counting, this razor-thin race looks to be coming down to the final few ballots.

Democratic opponent Christy Smith, a first-term state assemblywoman, accused Rep. Garcia’s victory declaration as being “dangerous to our democratic process.” She then immediately filed a 2022 congressional committee with the Federal Elections Commission. Therefore, if Garcia does in fact win the contest, it appears we will see the third edition of a Garcia-Smith campaign two years from now.

Continue reading

Iowa: Questioning the Polls

By Jim Ellis

Oct. 19, 2020 — Every political observer remembers that the cumulative polling community incorrectly predicted the Great Lakes states of Michigan, Pennsylvania, and Wisconsin in the 2016 Trump-Clinton presidential race, but further research finds additional significant misses in succeeding elections.

Political research reveals that two of those campaigns came in Iowa during the 2016 presidential race and the hotly contested governor’s race two years later. Today, we look at the Hawkeye State numbers with the goal of potentially ascertaining if there is a common polling pattern or consistent error factor.

In October, four polls have been released for the 2020 contest from a like number of different pollsters, two from left of center organizations while the other two are independent entities. The research organizations are Data for Progress, Civiqs for the Daily Kos Elections webpage, YouGov, and Quinnipiac University. Each has conducted one October Iowa survey.

In the presidential race, the polls yield former vice president Joe Biden an average lead of just over one percentage point. The cumulative ballot test mode then finds Des Moines real estate executive Theresa Greenfield (D) topping Sen. Joni Ernst (R) with a margin of four percentage points.

How do these numbers compare to recent polling vs. results electoral history, and is there an inherent Republican under-poll present?

In 2016, the Real Clear Politics polling average from Nov. 1-4 found then-candidate Donald Trump leading former Secretary of State Hillary Clinton by a mean average of three percentage points derived from three polls and three different polling firms. On Election Day, Nov. 4, 2016, Trump carried the state by a much larger 9.5-point margin.

Overall, 26 Iowa polls were released during the 2016 election cycle, with Trump recording a cumulative average lead of under half of one percentage point. According to the Real Clear Politics polling archives, 12 firms combined to reach the grand total, including Public Policy Polling (5 surveys), NBC News/Wall Street Journal/Marist College (5), Loras College (3), Quinnipiac University (3), Emerson College (2), and Selzer & Company for the Des Moines Register (2). The widest spread came from Loras College (Clinton plus-14) at the end of June. The Selzer & Company for the Des Moines Register poll produced the most accurate finding, Trump plus-7, at the very end of the election cycle (Nov. 1-4, 2016).

Continue reading

The Trafalgar Effect

By Jim Ellis

Oct. 15, 2020 — The Trafalgar Group is the polling firm that came to national political notoriety four years ago when they correctly predicted a Donald Trump victory in both Michigan and Pennsylvania and were the only survey research firm to do so. Since that time, they have forecast at least four other wins when the active polling community was arriving at opposite conclusions.

Yesterday, Trafalgar released its latest Pennsylvania data (Oct. 10-12; 1,034 likely Pennsylvania voters) and finds former vice president Joe Biden leading President Trump 47.4 – 45.1 percent — just over a two-point spread. In October, not counting the Trafalgar number, we see 12 other pollsters returning Pennsylvania data and they average a pro-Biden forecast of just under seven points.

Routinely, Trafalgar’s data shows President Trump in better position than most pollsters because they attempt to quantify what is termed the “shy Trump voter,” i.e., those who are actually voting for the incumbent but won’t admit it to a pollster. In most cases, the Trafalgar calculations, derived from a proprietary algorithmic formula, have been reliably accurate.

From 2016, we remember that, generally, the polling community missed badly in the Trump-Clinton presidential race. While their national count was accurate – predicting a tight plurality for Hillary Clinton (final result: 48.2 – 46.1 percent) – many state projections were off, particularly those in the Great Lakes region.

In the previous presidential election cycle, a total of 62 surveys were conducted in the state of Pennsylvania, and only three found a lead for President Trump, including the Trafalgar pre-election survey. In Michigan, 45 polls were publicly released, and Trump led in just two, one of which was Trafalgar’s final 2016 study. In Wisconsin, 33 polls were taken, and none found President Trump running ahead. Yet, in all three cases, he won the state.

The Great Lakes/Mid-Atlantic region was not the only area where 2016 polling missed the mark. In North Carolina, the margin average looked to be dead even heading into the election, but President Trump won with a 3.6 percent spread. The cumulative polling missed Arizona by two points, and Florida by 1.2 percent. In all of these instances, the Republican voted was under-estimated.

Continue reading

A Polling Comparison

By Jim Ellis

Neck-and-neck polling in a few key battleground states between President Donald Trump and former vice president Joe Biden shows interesting parallels to the 2016 race between Trump and Hillary Clinton.

Sept. 10, 2020 — With a plethora of presidential polls being released every week providing sometimes radically diverse results, it is often difficult to draw a clear picture of where the electorate is heading.

The conventional wisdom and preponderance of polling trends suggest that Joe Biden is leading the presidential race, but that President Trump is making a comeback, and the race is beginning to show some of the same characteristics found in 2016.

Three of the key states that baffled the political pollsters four years ago were Michigan, Pennsylvania, and Wisconsin. As we will remember, President Trump was expected to lose them all but scored close upset victories in each place.

The aggregate group of 2016 pollsters missed in each of the three states and the Real Clear Politics polling archives still publicly maintains all of those survey results. Therefore, we have the historical data to draw clear parallels between then and now.

In Wisconsin, 33 polls were taken during the election cycle and only one, from the Trafalgar Group at the end of the campaign season, placed Trump in front. A total of 62 polls were conducted in Pennsylvania with only three, again including a Trafalgar poll, projecting the future president into the lead. In Michigan, 42 polls were publicly released with Trump ahead in just two.

Though it is not generally statistically significant to average polling results because the polling methodologies, and certainly sample sizes, are very different, doing so does give us a guide as to the error factor that was present in 2016, and possibly a glimpse into what might exist this year.

In Wisconsin, the average Hillary Clinton lead advancing into the general election was 6.5 percentage points. With a 0.7 percent win for Trump, the overall error factor became a whopping 7.2 percent. The Pennsylvania numbers were closer but still a significant miss. Clinton’s average lead heading into Election Day was 2.1 percent and the president won there by the same 0.7 percent that he carried Wisconsin. Therefore, the Keystone State error factor was 2.8. Michigan was a similar story. Error factor: Clinton plus-3.6 percent. Trump victory margin: just 0.3. Total Michigan error factor: 3.9.

Continue reading

Nevada: A Target?

By Jim Ellis

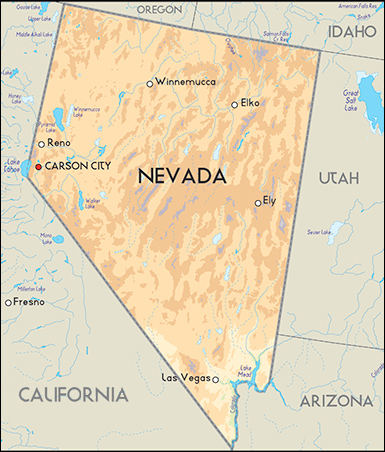
May 8, 2020 — The Silver State of Nevada, with six Electoral College votes, has been regarded as a swing state in most 21st Century presidential elections, but in projecting the 2020 vote, it is routinely considered as a place destined to land in the Democratic column. But, could Nevada ultimately be in play for President Trump?

With a general election electoral vote map looking ever closer as we move toward November, introducing a new target could drastically change the eventual outcome or at least the campaign focus and strategy.

A new ALG Research poll (April 27-30; 76 likely Nevada general election voters) reports findings that are consistent with virtually all of the 2016 Nevada general election surveys. Last week, the firm found former vice president Joe Biden leading President Trump with a 49-45 percent spread. Such a margin and preference percentages fall into the same realm as all 31 polls conducted in Nevada from May through the November 2016 election.

When ‘16 ended, Hillary Clinton carried the state, but her margin was only 2.4 percentage points, meaning a 27,000-vote spread of more than 1.12 million ballots cast. And, consistent with the large number of polls that concluded a close race within the 40s would be the actual result, Clinton defeated Trump, 47.9 – 45.4 percent, validating the plethora of research conducted over the final five-plus months of that election cycle.

Four years ago, 13 different pollsters conducted the almost three dozen surveys, and in no instance did either Trump or Clinton ever reach the 50 percent plateau. On the other end of the spectrum, in just three instances did one of the candidates dip below 40 percent. Therefore, in 28 of the 31 studies logged within the 2016 Real Clear Politics polling archives, both candidates fell within the 40s, meaning this result occurred over 90 percent of the time. In terms of range, the span stretched from Clinton plus-7 to Trump plus-6, but the average between the two was only 2.7 percent, which is almost exactly the actual final total. This obviously suggests a competitive political battlefield.

Continue reading