Tag Archives: Election Day

“Blue Wave” Absent in Arizona Races

By Jim Ellis

L-R -- Arizona Reps. Kyrsten Sinema (D-Phoenix) and Martha McSally (R-Tucson)

From left to right, Arizona Reps. Kyrsten Sinema (D-Phoenix) and Martha McSally (R-Tucson)

Nov. 2, 2018 — It was always believed that the Grand Canyon State’s open Senate race between Reps. Kyrsten Sinema (D-Phoenix) and Martha McSally (R-Tucson) would be one of the best campaigns in the country, and no one should be disappointed.

As we approach Election Day, differing indicators have presented themselves regarding who might win this toss-up campaign. Five polls have been released covering the period between Oct. 23-29. Three of the five give Rep. Sinema a slight lead, while one projects a tie.

YouGov/CBS News (Oct. 23-26; 972 likely Arizona voters) and Marist College/NBC News (Oct. 23-27; 506 likely Arizona voters) both post the Democratic nominee to identical 47-44 percent leads. CNN/SSRS (Oct. 24-29; 702 likely Arizona voters) finds Sinema’s edge to be 51-47 percent. But HighGround Public Affairs (Oct. 26-28; 400 likely Arizona voters) sees Rep. McSally ahead, 47-45 percent. Fox News (Oct. 27-29; 643 likely Arizona voters) came to a third conclusion, a 46-46 percent tie.

Continue reading

Ohio: Contrasting Polls

By Jim Ellis

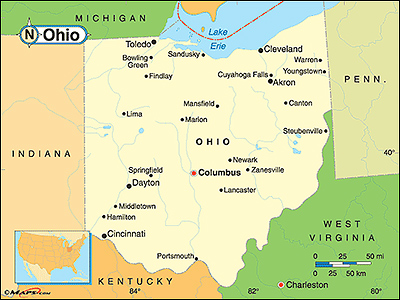
state-of-ohio-mapNov. 1, 2018 — The Buckeye State of Ohio is viewed as one of the country’s quintessential swing states. In 2016, however, the state exceeded polling and even Republican expectations in their presidential vote, as President Trump won a decisive 52-44 percent victory over Hillary Clinton.

Some suggested the Trump vote was an indication that the state could be moving more definitively to the political right, but new surveys suggest the Buckeye electorate is returning to its previous swing vote history.

Still, Ohio proves a reliable national political barometer. In both 2008 and 2012, the electorate here voted for President Obama after twice after backing President George W. Bush in his two elections. The state previously favored President Bill Clinton in his two successful national campaigns. In fact, the last time Ohioans failed to vote for the winning presidential candidate came in 1960 when the state awarded its electoral votes to Republican Richard Nixon in his national losing effort against John F. Kennedy.

Two new polls were released this week that paint different pictures of the Ohio electorate’s current state. Some of the results are curious to the point of questioning the polling reliability or not being able to adequately determine how the governor’s race will end and failing to understand the wide discrepancy in US Senate polling projections.

Continue reading

National Early Voting Report

By Jim Ellis

i-vote-i-countOct. 31, 2018 — Now more than halfway through the early voting period in the 37 states that offer early voting options for the populace, some places are turning in record participation rates. Each state has various nuances in their early voting procedures, so comparing the early reports to each other is of little value. Going back to contrast the current 2018 reported numbers with how that particular state voted in the last midterm election (2014) does have significance, however.

Already, in the latest available reports according to the United States Election Project administered by the personnel at the University of Florida, seven states are reporting more received early voting ballots than were recorded for the entire 2014 pre-election period. They are:

• Tennessee – 162.3% more ballots (1,029,846 versus 634,364 recorded in 2014)
• Texas – 144.3% increase (2,980,915 versus 2,066,368 recorded in 2014)
• Indiana – 127.9% increase (292,726 versus 228,932 recorded in 2014)
• Nevada – 122.5% increase (372,455 versus 304,005 recorded in 2014)
• Georgia – 111.1% increase (1,188,636 versus 1,069,912 recorded in 2014)
• Minnesota – 106.0% increase (249,909 versus 235,808 recorded in 2014)
• Delaware – 103.2% more ballots (8,550 versus 8,288 recorded in 2014)


An additional seven states have so far recorded better than 85 percent of their early voting total in comparison to their entire 2014 pre-election voting universe:

• North Carolina – 97.1% of previous (1,140,657 versus 1,174,188 recorded in 2014)
• Virginia – 94.2% of previous total (191,755 versus 203,556 recorded in 2014)
Continue reading

With Media Focused on O’Rourke, Cruz Maintains Consistent Edge

By Jim Ellis

Texas Sen. Ted Cruz (R) | Rep. Beto O’Rourke (D-El Paso)

Texas Sen. Ted Cruz (R) | Rep. Beto O’Rourke (D-El Paso)

Oct. 25, 2018 — The Texas Senate race has become the premier political contest of this midterm election. With Rep. Beto O’Rourke (D-El Paso) becoming a national celebrity due to constant media attention, and now with record fundraising, this election has stretched beyond Texas and evolved into a national campaign.

Though the media continually promotes O’Rourke, extensive polling has only put him ahead of Sen. Ted Cruz (R) just once during the entire election cycle. Despite O’Rourke raising an eye-popping $38 million during the last quarter, an all-time record for any Senate race, Cruz’s margins are actually growing.

During this calendar year, 35 polls have been conducted of the Texas Senate race from 19 different polling firms. In only one, an online survey from Ipsos Reuters in early to mid-September (Sept. 6-14; 992 Texas respondents), did Rep. O’Rourke score an advantage over Sen. Cruz. In that poll, the El Paso congressman led 47-45 percent.

While Sen. Cruz held an advantage in the other 34 polls, his margin was typically small. His average support factor is 45.6 percent. He hits 50 percent or more in only 13 of the surveys. Rep. O’Rourke records an average of 41.1 percent and reaches 50 percent in one survey. While these numbers and margins clearly show weakness for an incumbent, as we pointed out when covering Sen. Claire McCaskill (D-MO) and Sen. Joe Donnelly (D-IN) in similar columns earlier this week, Sen. Cruz is demonstrating growth as the early voting period begins and Election Day draws nearer in contrast to the others who appear to be losing momentum.

In the last 10 polls, covering the Oct. 1-21 period from 10 different pollsters, Sen. Cruz averages 50.2 percent preference and posts majority support in seven of the 10 studies. Rep. O’Rourke averages 45.2 percent, leads in none, and obviously never reaches 50 percent. While Cruz maintains a consistent edge, O’Rourke remains in position if not to score an upset, at least to record the best Democratic statewide percentage since 1990, which was the last time a Democratic candidate won a Texas statewide office.

Continue reading

Florida Polling: Inconsistent Results

By Jim Ellis

Oct. 23, 2018 — Four statewide Florida polls were just released, and we continue to see conflicting results across the board two weeks prior to Election Day. As usual, the Sunshine State political situation appears too close to call from a place that seems to specialize in razor-thin elections.

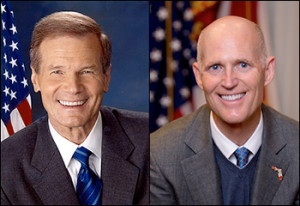
Left: Florida Sen. Bill Nelson (D) | Right: Gov. Rick Scott (R)

Left: Florida Sen. Bill Nelson (D) | Right: Gov. Rick Scott (R)

During the period of Oct. 17-21, St. Pete Polls, Survey USA, Quinnipiac University, and the Democratic polling firm of Schroth, Eldon & Associates all conducted Florida surveys.

In the Senate race, two of the surveys find incumbent Bill Nelson (D) putting some distance between he and his opponent, Gov. Rick Scott (R), while the other two project to give Scott a slight edge. In the governor’s race, three of these firms released numbers (Quinnipiac did not, but will likely do so today), and Democratic nominee Andrew Gillum, the Tallahassee mayor, holds a varying lead over former US Rep. Ron DeSantis (R).

There is quite a difference in the Senate margins, and this is largely due to how the female vote is being recorded. Both Survey USA (Oct. 18-21; 1,050 Florida adults, 859 registered Florida voters, 665 likely Florida voters) and Quinnipiac (Oct. 17-21; 1,161 registered Florida voters) find Sen. Nelson holding full-sample leads beyond the polling margin of error, 49-41 percent (S-USA) and 52-46 percent (Quinnipiac). They see females breaking for Nelson, 49-37 percent (S-USA) and 59-39 percent (Quinnipiac). Men are going the opposite way, favoring Scott, 49-46 percent (S-USA) and 54-44 percent (Quinnipiac).

Continue reading

Early Voting:
When, Where & Possibly Why

By Jim Ellis

voteOct. 10, 2018 — There is great discussion within political circles about the importance of early voting and whether an advantage can ascertained for one party or another, or if it is a predictor of the associated election that is decided in the succeeding vote.

As more states adopt early voting – 37 currently have enacted some form of the balloting process – it is still unclear as to whether it brings more voters into the election cycle. Offering elongated voting times does make ballot casting more convenient, no doubt, and Democrats usually are more prodigious in their use of the procedure, but there are no long-term patterns that suggest the use of early voting actually leads to more Democratic victories.

The early voting calendar is also elongating the election process, and the periods for such ballot casting are getting longer. Right now, pre-election voters in Colorado, Illinois, Minnesota, New Jersey, North and South Dakota, Vermont, and Wyoming already are casting their Nov. 6 ballots. This week, Arizona, California, Indiana, Iowa, Maine, Montana, Nebraska, and Ohio voters can join them. The states with the latest early voting start dates are Florida (Oct. 27), Maryland (Oct. 25), and West Virginia (Oct. 24).

Those who exercise their right to vote early, however, do miss the critical part of the advertising campaign, which may or may not cause them to re-think and change their votes, and it is clear that early voting has altered the campaign cycle. Thus, it is relatively clear that the more decided voters, possibly meaning the most partisan from the various parties, are the ones who generally cast their votes before Election Day.

The only states that carry early voting through Election Day itself are the three where all votes are cast via mail: Colorado, Oregon, and Washington. All others end early voting before the official Election Day, which is Nov. 6 this year.

Continue reading

Forecasting the Results – Part II

By Jim Ellis

2018-democrat-house-majority-breakdown-text-graphicOct. 8, 2018 — The Democrats need to convert a net 24 seats to secure a one-seat majority in the US House on Election Day, Nov. 6. Many reports quote the number 23 as what is necessary to win control, but the new Pennsylvania map will yield one seat coming back to the Republicans — the new open 14th District — thus pushing the total up to 24.

As stated Friday, our forecasts listed below are based upon a series of factors, including current polling numbers, voter history, candidate personal and job approval favorability, fundraising, other races on the state ballot that could drive turnout, and outside issues such as the confirmation vote to for Judge Brett Kavanaugh to become a Supreme Court Justice, which could change the turnout model, etc.

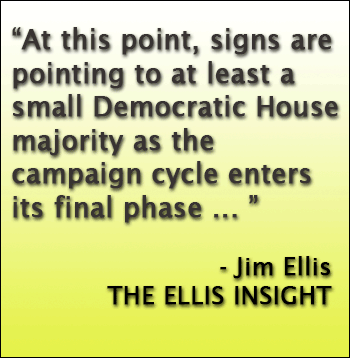
According to our new analysis, the Democrats are on the cusp of converting the requisite number of Republican seats to take a bare majority and seeing their caucus become significantly larger. At this point, the Democratic gain range appears to reach 23 on the low side and 35 at the apex.

Looking at the country by state and region, it appears the Democrats will do well in the Midwest, in particular. The Great Lakes region that delivered President Trump his surprise victory appears to be snapping back to the Democrats in the midterm House races. Michigan looks particularly good for them at both the statewide and district levels.

Continue reading