Tag Archives: Ronald Reagan

Comparing Biden

President Joe Biden / Photo by Gage Skidmore

By Jim Ellis — Thursday, Aug. 3, 2023

President

Polling: Biden at Lowest Job Approval Rating — News reports are quoting the recent CBS News poll from the YouGov international polling firm (July 26-28; 2,181 US adults; online) as giving President Joe Biden his lowest job approval rating to date. The CBS result found a whopping 60 percent saying they disapproved of the president’s performance in office.

Lately, presidential job approval polling is prevalent. Several firms, such as Morning Consult and Rasmussen Reports, track presidential job performance daily. Therefore, we frequently see a rather wide range of Biden performance ratings on a regular basis.

According to the FiveThirtyEight data organization, President Biden’s positive job approval response from July 26 through Aug. 1 ranged from 35 percent (Premise) all the way to 47 percent (Rasmussen Reports). The president’s disapproval score was recorded from a low of 51 percent (Rasmussen) to a high of 60 percent (YouGov for CBS; Premise).

Regardless of how the job approval research data may vary from day to day, it is curious to see just how these numbers compare with the historical presidential research. The Gallup data firm began presidential approval polling and has charted it ever since President Harry Truman began preparing for the 1948 national election.

According to the current Gallup data, last recorded on President Biden’s 918th day in office, 40 percent of the sampling universe graded him with a positive job approval score (Gallup only records the positive approval response on their historical chart).

Reviewing the 14 presidents from Truman through Biden, inclusive, we look at where certain other presidents stood at around this same time in their own administrations. Interestingly, three other presidents were within the same approval rating realm as Biden at this same approximate point in their presidencies. The three are: Donald Trump (42 percent at the 922nd day of his presidency); Barack Obama (42 percent; 929); and Ronald Reagan (44 percent; 923).

As you can see just from this group, presidential approval 18 or so months before the general election is not an absolute predictor as to whether the subject wins or loses the succeeding national election. Just from the above sample of three, we see one who lost (Trump) and two who won (Obama, Reagan). President Reagan, in fact, had the highest growth rate from his standing 923 days into his term to his final vote percentage of all 14 charted presidents (44 percent approval; 58.8 percent vote percentage in the 1984 election; a comparative gain of 14.8 percentage points).

This tells us that presidential job performance between the commensurate benchmark point in time and the election, and running a sound campaign, are far more important factors in determining presidential re-election outcome than job approval at this point in the term.

Interestingly, the three presidents with the highest approval rating at the commensurate benchmark who ran for re-election: George H.W. Bush (72 percent approval; 905th day in office); Dwight Eisenhower (72 percent; 910); and George W. Bush (62 percent approval; 900) were also the three who lost the most percentage points from their approval ratings in comparison to their ending vote percentage.

In fact, as we know, the leader at this commensurate point, George H.W. Bush with a 72 percent positive job approval, would go on to lose re-election with a finishing popular vote percentage 34.5 points lower than his approval score 18 months before the 1992 national vote. Both presidents Eisenhower and George W. Bush followed the same pattern, but not as dramatically. Eisenhower dropped 14.6 percent from his approval rating to final vote percentage, and Bush, 11.3 percent.

Overall, of the 14 presidents with recorded job approval scores throughout their tenure in office, seven won the succeeding election and four lost. Two — presidents John F. Kennedy and Lyndon Johnson — did not seek another term. Obviously, Kennedy had been assassinated, while Johnson declined to run.

Of the seven who won the succeeding election, four had positive job approval ratings approximately 18 months before the vote (Truman, Eisenhower, Richard Nixon, and George W. Bush), while three did not (Reagan, Bill Clinton, and Obama).

From the group of four presidents who lost the succeeding election, two had positive ratings approximately 900 days into their terms (George H.W. Bush and Gerald Ford), and two were in upside-down territory (Jimmy Carter and Trump).

Though President Biden has low approval ratings at this juncture, it is by no means certain that he will fail to win re-election in 2024. History tells us that any result can still happen.
Conflicting Electorate Clues

By Jim Ellis

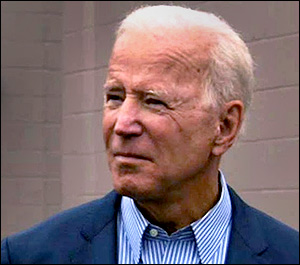
President Joe Biden lingers at the bottom of presidential rankings after his first 100 days.

May 24, 2021 — Data points are routinely being published covering the electorate’s status, leading to various conflicting conclusions. This allows both Democrats and Republicans to promote favorable prediction trends for the 2022 elections.

Presidential job approval is often used as a key prediction benchmark. The Gallup Research organization pioneered presidential job approval tracking, beginning in the 1950s with President Dwight D. Eisenhower, and the tradition continues today.

During that approximate 70-year period, the average performance for a newly elected president in his first 100 days in office is 61 percent favorable. Only those presidents who were elected are included in the Gallup survey. This means that presidents Lyndon B. Johnson, who ascended to the office when John F. Kennedy was assassinated, and Gerald R. Ford, who became president when Richard M. Nixon resigned, are not included.

If you remove, however, the highest rated national leader, President Kennedy (81 percent approval) and the lowest, President Donald J. Trump (41 percent), the adjusted average climbs to 63 percent.

In his first 100 days, Gallup rates President Biden with a 57 percent approval figure, thereby placing him as only the 9th most popular of the 11 newly elected modern era chief executives.

The top three rated presidents in their first 100 days are Kennedy (81 percent), Eisenhower (74 percent), and Ronald Reagan (67 percent). The three lowest are presidents Trump (41 percent), Bill Clinton (55 percent), and Biden (57 percent).

Other surveys rate Biden’s performance somewhat lower, however. In the month of May, eight additional pollsters have tested the president’s job performance and found his favorable score in a tight range, from 51-54 percent with his disapproval percentage spanning from 35 to 48.

The generic polling question is one where a survey respondent is asked whether they would vote for the Republican or Democratic House of Representatives candidate. Right now, we’re seeing the generic numbers span the ideological spectrum, which tells us the great partisan divide is still very much alive. The left-leaning pollsters are seeing big leads for Democrats, while the more conservative-oriented pollsters find the responses very tight.

Continue reading

The Presidential Debates Loom

By Jim Ellis

Sept. 1, 2020 — The Presidential Debate series looms on the political horizon, and controversy is beginning to swirl even though the first forum is still a month away.

The first in a series of currently three presidential debates is set for Sept. 29.

House Speaker Nancy Pelosi said last week that Democratic nominee Joe Biden shouldn’t debate President Trump. “I wouldn’t legitimize a conversation with him, nor a debate in terms of the presidency of the United States,” she was quoted as saying at a news conference.

At the end of July, former Bill Clinton news secretary Joe Lockhart wrote for CNN.com that Biden shouldn’t debate the president. “Whatever you do, don’t debate Trump. Trump has now made more than 20,000 misleading or false statements according to the Washington Post,” Lockhart penned as public advice to Biden.

Some on the Republican side argue that these Democratic leaders are beginning to lay the groundwork for Biden to avoid the debates because of concerns their candidate would fare poorly opposite President Trump.

For his part, Biden says he will debate the president, and become his own “fact checker on the floor.” He will also begin holding campaign events after Labor Day. In an Aug. 28 interview with the Associated Press, Biden said he’ll “meet people where it matters – not at irresponsible rallies or staged for TV to boost egos, but real people’s communities, in real local businesses, in their lives.” Biden further said he’ll “hold events consistent with the state rules about crowd sizes and other regulations.”

The first debate is scheduled for Tuesday, Sept. 29, the second on Thursday, Oct. 15, and the final forum culminates a week later on Oct. 22. The vice presidential debate between incumbent Vice President Mike Pence and Sen. Kamala Harris (D-CA) is scheduled for Wednesday, Oct. 7.

The debates have proven important in the past and always draw large audiences. According to the Pew Research Center, even the first televised debate, between then-Sen. John F. Kennedy and then-Vice President Richard Nixon, drew over 66 million viewers usually on black and white televisions, at a time when the US population was just under 181 million people, or approximately 55 percent of today’s total populace.

Continue reading

Monitoring Mail-in Vote Turnout

By Jim Ellis

July 7, 2020 — With many states emphasizing mail voting as a way to increase voter participation in the COVID-19 era, has adoption of near universal mail voting in the states that have done so achieved its fundamental purpose, or has it caused more problems than it solved?

Voter turnout is always a definitive factor in determining election outcomes, and the push to change voting procedures has occurred in 31 state primaries. Therefore, the voting system alterations, should they continue into the general election, will most likely have a major impact upon the electoral outcomes.

Most of the states adopting change only expanded their mail absentee ballot procedures for the primaries; therefore, we can expect another round of battles over the general election processes to soon come before legislatures and courts.

Many of the states, Maryland, Georgia, Nevada, Pennsylvania, and New York to name several, had administrative problems with their expanded mail programs including reports of homes receiving multiple ballots because inactive voters were forced to be mailed, some people requesting absentee ballots and not receiving them, and long post-election counting periods because of the large number of mail ballots coming into the county clerk’s offices.

New York, in fact, has still not even completed its unofficial tabulation and the primary was June 23. The Clark County (Nevada) County Clerk said publicly that the directive to mail inactive voters led to chaos in the state primary since so many ballots were being sent to individuals no longer living at the mailed address.

Largely, Democrats and voting rights organizations are attempting to persuade legislatures, governors, and/or the courts to expand the mail absentee ballot voting option to all registered voters both active and inactive, enact same-day voter registration, adopt ballot harvesting, which allows any individual to collect ballots from voters and turn them into county election authorities (this process is only legal in California, to date), and allow ballots to be post-marked on Election Day as opposed to requiring that they be received on voting day. Republicans and conservative organizations typically object to most of these ideas on verification grounds.

Continue reading

Alabama Senate Race Begins

By Jim Ellis

Rep. Bradley Byrne, a Republican, formally announced his candidacy for the Senate.

Feb. 25, 2019 — One of the critical 2020 US Senate contests is beginning to take shape. Over the past few days, Alabama Rep. Bradley Byrne (R-Mobile) formally announced his statewide candidacy with the goal of opposing Democratic Sen. Doug Jones, who won the controversial 2017 special election that attracted national attention.

The Jones victory, defeating beleaguered Republican Roy Moore, a former state Supreme Court Chief Justice, represented the first time a Democrat won an Alabama statewide federal election since incumbent Sen. Howell Heflin secured his final term in 1990.

Prior to that, Richard Shelby, then a Democratic congressman, unseated Republican Sen. Jeremiah Denton in 1986. Shelby then switched to the Republican Party immediately after the 1994 election. Prior to the Denton victory on the same night that Ronald Reagan was first elected president, no Republican had won an Alabama seat for more than 100 years.

The Yellowhammer State Senate race could well be the lynchpin to determining which party will control the chamber after the 2020 election. With the electoral map favoring the Democrats because Republicans must defend 22 of the 34 in-cycle seats, including the Arizona special Senate election, Alabama becomes a virtual “must-win” for the GOP.

Continue reading

Why Trump Is Right on the Polls

By Jim Ellis

May 2, 2017 — President Trump’s retaliatory attacks against the latest major media polls may actually be more correct than even he alludes. The nation’s chief executive predictably came out swinging against ABC and NBC News regarding their newly released polls that found just over 40 percent of their sampling groups approve of his job performance, the worst of any president after 100 days in office.

Trump reminded his audience that those two particular polls were wrong in their election predictions, but the survey representatives quickly shot back to point out that their pre-election projection of Hillary Clinton winning the popular vote was in fact accurate. These pollsters are correct in this particular assertion, but we all know that the individual state polling, particularly in the key Great Lakes states like Pennsylvania, Michigan and Wisconsin, was badly flawed and completely missed the mark.

Digging deeper into the current and past election polls does produce a little known factoid, however, and one that the president should find comforting. While the ABC and NBC representatives say their data find Trump to be the most unpopular short-term president, they fail to draw upon a critical comparison factor from their own previous polls.

Continue reading

The September Reset

By Jim Ellis

Sept. 6, 2016
— Labor Day is always viewed as the traditional general election initiation benchmark for presidential campaigns, so it is important to see where the candidates stand now that we have reached this point in time.

During the Aug. 24-30 period, five national polling entities surveyed the national electorate. The five: USA Today/Suffolk University, Rasmussen Reports, Fox News, Reuters/Ipsos, and The Economist/YouGov find a margin range of Hillary Clinton topping Donald Trump by seven percentage points (USA/Suffolk: Aug. 24-29, 1,000 US likely voters, 42-35-7-4 percent, including Libertarian nominee Gary Johnson and Green Party candidate Jill Stein) to the Republican going up by a single point (Rasmussen Reports; Aug. 29-30: 1,000 US likely voters, 40-39-7-3 percent).

Together, the five polls produce a net average Clinton edge of 3.0 percentage points with neither candidate exceeding 42 percent support nor dropping below 35 percent.

Turning to a historical comparison, where have other presidential campaigns stood on Sept. 1, and how can previous patterns help us project what may happen in this current election?

Continue reading

The Historical Perspective

By Jim Ellis

Aug. 31, 2016 — Everyday we see new polls that measure Hillary Clinton and Donald Trump’s national standing and their status in some states, but how does the 2016 race compare to the others from the past 40 years during this same time point in the election cycle?

The Gallup organization is the only consistent national pollster from the mid-20th Century through the 2012 election. After missing the final result four years ago in which they predicted a Mitt Romney popular vote victory, Gallup now confines their research work to issues and not head-to-head ballot test questions. Therefore, they are not polling the Clinton-Trump race.

Since Aug. 20, seven polls from a combination of professional national pollsters, media outlets, and universities have been publicly released. Six of the seven find Clinton holding the lead. One, the Los Angeles Times/University of Southern California’s continual panel-back tracking program, says Trump is carrying a two-point advantage. Factoring in these recent seven results, Clinton’s average advantage is 3.4 percentage points, usually in the span of 42-38 percent.

Continue reading

Predicting the Presidential Outcome

At long last the election is finally here, but we still can’t predict the presidential outcome with any confidence. Recognizing that there have been many conflicting national polling factors present for the past several weeks, now at the end of the campaign it appears that all of the major pollsters are projecting just about the same final national popular vote result – a virtual tie.

Seven polls were released on Thursday through Saturday, and four of them (Ipsos/Reuters, Rasmussen Reports, UPI/C-Voter, and Zogby for the Washington Times) produced a high-40s deadlock between Pres. Barack Obama and Republican challenger Mitt Romney. Two (Purple Strategies and Public Policy Polling) forecast a one-point lead for Obama. One, the ABC/Washington Post poll, showed Romney with that same single-point advantage. Simply put, the national election doesn’t get any closer.

Good news actually exists for both candidates in these final surveys. First, bringing the candidates back into a tie is positive for the president, who had been starting to drop behind. On the other hand, and an argument in Romney’s favor, an incumbent tied going into the election is rarely a good sign, because challengers typically under-poll to at least a small degree.

On the state front, Ohio still appears to be the deciding factor. There are some favorable indications that Romney will win close victories in North Carolina and Florida, which are his top priority conversion states. He also is trending upward in Virginia, but the all-important Buckeye State remains a mystery. The president has a slight edge in several polls, but not in others.

Looking at the secondary states, though Nevada and possibly Iowa look to remain in the president’s column, Romney is getting strong positive signs from Colorado. Should he be successful in taking Virginia and Ohio, Colorado would clinch a victory for the challenger.

Polling

There has been a great deal of analyses done about the myriad of polls conducted over the past months, and the conflicting nature between the ones that have projected the 2012 vote using a turnout model based upon 2008 voting patterns. Many have said that using such base data explains the polling discrepancies because the 2012 electorate is much different than that of four years ago. Therefore, using the 2008 model may skew too heavily Democratic.

Mike Barbera, a Washington lobbyist and guest columnist for our reports, has studied this situation, and offers the following perspective: Given all available evidence, the idea that the 2012 electorate will be as Democratic as 2008 is implausible – and the notion that it will be even more Democratic is to be completely rejected.

The 2008 election cycle featured the following:

  • A highly motivated Democratic base, enthused by the historic candidacy of Barack Obama and still seething with animus toward George W. Bush
  • A dispirited Republican base (although the Palin vice presidential selection remedied this to a certain degree)
  • A historically-unpopular outgoing Republican president
  • A huge funding disparity, which allowed the Obama campaign to dramatically outspend the McCain forces on the airwaves and in the get-out-the-vote (GOTV) efforts
  • An economic meltdown a month before Election Day

That is a recipe for what a great Democratic year looks like – and indeed the Democrats in 2008 had a great year. They elected a president as well as super-majorities in both the House and Senate.

To put it mildly, 2012 looks nothing like 2008. By any measure, Republican enthusiasm is much higher than in 2008. Obama’s favorability ratings are significantly lower than they were in 2008. His job approval ratings are dismal. Romney and his GOP allies are at financial parity with the Obama campaign and the Democrats – so the Republican GOTV efforts are vastly improved from the threadbare McCain operation of 2008. Romney is doing very well among independents – John McCain lost them by a substantial margin.

Early Voting

States are reporting the number of ballots already returned through the various early voting processes. While all of the partisan numbers, i.e. the ballots returned from registered Democrats, Republicans, and unaffiliated voters, are better for Romney and the Republicans than the ratios from four years ago, it is unclear if they are a precursor to a Romney victory performance.

The Romney camp compares the current early voting trends to that of 2008 GOP nominee John McCain and illustrates what they believe is their candidate’s improvement over his showing. While there seems no doubt that the already returned ballots will yield better results for the Republican, as the Obama campaign points out, Romney must exceed the president’s vote total, not just that of McCain, and in every state but Colorado (that releases early voting partisan registration data) more Democratic ballots have been returned than Republican. All totaled, almost 30 million people have already voted in this election.

The Senate

Democratic trends in the statewide contests are better than for Republicans. It now appears likely that the Democrats will retain control of the Senate and do so with about the same level of strength they currently maintain: a seat up or down from the current 53D-47R margin.

The House

While the Senate races appear to be trending Democratic, the Republicans are pulling away in the House. The GOP majority is secure, and their original majority margin, based upon 242 seats, could even increase by as many as three or four seats when analyzing the final individual race trends.

Conclusion

This election is very close, and could be following one of two election models. The first would be that of 1980, where Ronald Reagan was running close to incumbent President Jimmy Carter, only to catch a wave at the very end and go onto a major landslide victory. The second potential precursor is the 2004 election, where a relatively unpopular incumbent President, George W. Bush, won a close victory that basically came down to the state of Ohio becoming the deciding factor. Determining the actual result is now merely hours away.

Obama Approval Ratings Reach Historic Lows

While the attention of most political observers and pundits has been on the extremely volatile multi-candidate contest for the Republican presidential nomination, little attention has been paid to the standing of the certain Democratic standard-bearer, President Barack Obama.

Polling by the Gallup organization, which has been tracking presidential approval ratings since the administration of Harry S. Truman, suggests that President Obama’s approval rating is lower than each of his eleven most recent predecessors at a comparable time in their presidencies. This statistic includes: Lyndon Johnson, Gerald Ford, Jimmy Carter and George H. W. Bush, who were either not reelected or, in the case of Ford, never elected.

For the week ending Dec. 4, Obama’s approval rating stood at 42 percent, down one percent from his historically low November rating of 43 percent. The President’s disapproval rating currently stands at 50 percent, up one point from last week’s number. Again, all of these numbers are according to Gallup. Obama will need to improve his approval rating considerably during the rest of December in order to avoid numbers that are sure to initiate jitters among congressional Democrats and others sharing the ballot with him in 11 months.

The following chart provides an illustration of the presidential approval rates at the commensurate time in office (December of third year in office):

President      Year     Average approval
Eisenhower      1955                     75
Nixon                1971                      50
Carter                1979                     53
Reagan              1983                     54
Bush ’41            1991                      51
Clinton              1995                     51
Bush ’43            2003                    54
Obama              2011                      42 (through December 6)

As you can see, public approval ratings at the end of the third year of an incumbent’s presidency does not necessarily dictate his re-election result. For example, Presidents Carter (53 percent) and Reagan (54 percent) had virtually identical numbers at the end of their third year in office, but their election results one year later, as we all know, were starkly different. The same was true for Presidents Bush and Clinton, who both scored an identical 51 percent in the December preceding the election. But, Obama’s anemic 42 percent positive rating is far below any of his predecessors. It is too early to tell, however, whether or not this number will prove to be a precursor to defeat.