Tag Archives: Gallup

Gallup: A Changing Electorate

Gallup Poll Results: To see complete story/data/polling results, go to: Gallup News

By Jim Ellis — Friday, Feb. 23, 2024

Polling

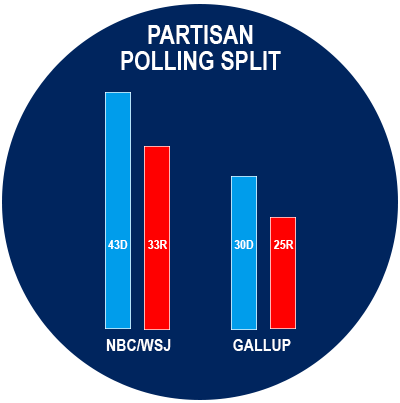
Nationwide Polling: Multiple Demographic Swings — The Gallup research organization released a new nationwide study earlier this month, which is a part of the entity’s Gallup Poll Social Series. The surveys are conducted throughout the year, of at least 1,000 US adults, and they cover 12 different topics annually, meaning a different subject matter each month.

The current release covers where certain segments of the American electorate now stand with reference to their political party preference. One of the key findings is that both parties are gaining strength among some constituencies, while losing it among others.

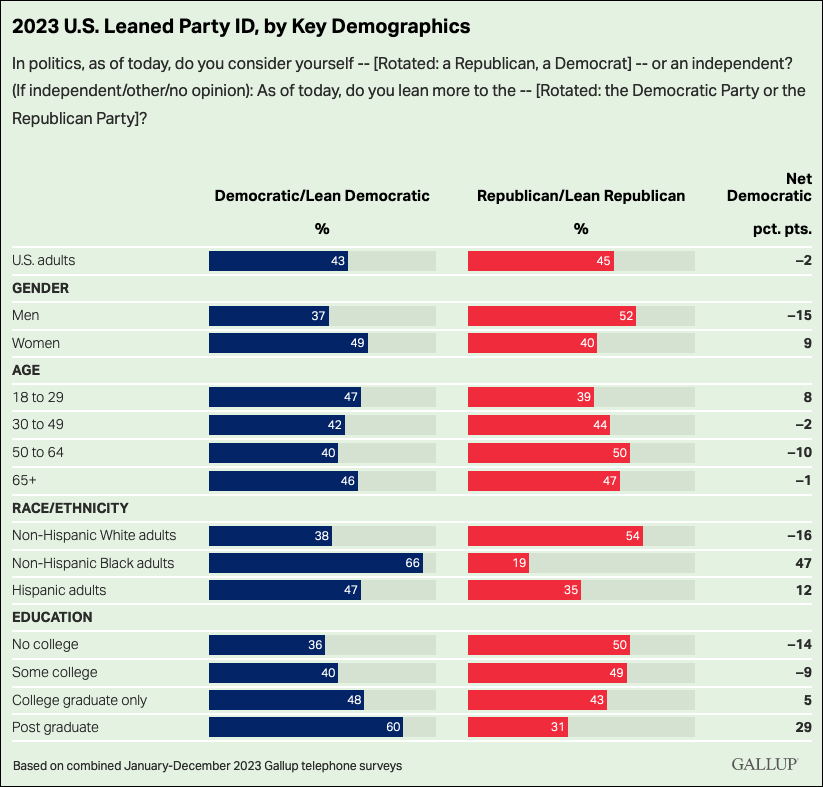
Gallup finds the Republicans are gaining strength with minority voters, while Democrats are clearly becoming the party of the higher educated.

Among black voters, Republicans have gained almost 20 percentage points just since 2019 when compared to Gallup’s historical surveys. While still having a strong allegiance toward Democrats, blacks now only favor the party by a 47-point span. In 2019, the Democratic margin over the Republicans was 66 points, and even that figure is down from the Democrats’ apex point of 79, which was reached in 2008.

Among Hispanics, Democrats reached their apex in 2016 when they enjoyed a 36-point preference margin over Republicans within this demographic. The current Gallup national survey yields a stark result, finding the Hispanic Democratic advantage today has slipped to only 12 percentage points.

The non-Hispanic white category has also moved considerably toward Republicans, though it wasn’t long ago that the Democratic share of the national electoral vote was at parity with Republicans. In 2007, Democrats had a one-point edge over the GOP within the non-Hispanic white segment. Currently, the pollsters find the spread at 17 points between the two parties, favoring Republicans.

The news isn’t all bad for Democrats, however. Gallup continues to see major shifts among the higher educated voters who are significantly breaking away from the Republicans. Today, the trend shows a 29-point Democratic advantage over Republicans among postgraduate individuals, which is a considerable shift from 2010 when the Democratic edge was 11 percentage points. During that same time frame, the college graduate sector has gone from a nine-point preference for Republicans to what is now a five-point edge for Democrats, which is a swing of 14 points toward the latter party.

In the education category, however, the group that has demonstrated the most radical swing are those not having gone to college. In 2006 through ’08, the Democrats had a consistent 16-point edge. The latest Gallup survey finds almost the opposite result, with Republicans now holding a 14-point advantage within this same category.

Though these particular demographic and personal trait segments are reporting some different partisan allegiance predispositions this does not necessarily mean we will see a commensurate change in voting behavior. Obviously, the candidates matter as does the persuasion communication method developed for the individuals comprising these groups who are apparently more receptive to a different political message today than those from a previous time frame.

This at least partially explains why the vote patterns have not been running parallel to the sentiments detected in this Gallup poll and from other survey entities who are finding similar results.

This type of research does tell us, however, how campaign targeting strategy and communication approach might change for 2024 in comparison to previous elections from the past decade. The party that learns to best manage this changing electorate will be the one enjoying the most success in November.

Comparing Biden

President Joe Biden / Photo by Gage Skidmore

By Jim Ellis — Thursday, Aug. 3, 2023

President

Polling: Biden at Lowest Job Approval Rating — News reports are quoting the recent CBS News poll from the YouGov international polling firm (July 26-28; 2,181 US adults; online) as giving President Joe Biden his lowest job approval rating to date. The CBS result found a whopping 60 percent saying they disapproved of the president’s performance in office.

Lately, presidential job approval polling is prevalent. Several firms, such as Morning Consult and Rasmussen Reports, track presidential job performance daily. Therefore, we frequently see a rather wide range of Biden performance ratings on a regular basis.

According to the FiveThirtyEight data organization, President Biden’s positive job approval response from July 26 through Aug. 1 ranged from 35 percent (Premise) all the way to 47 percent (Rasmussen Reports). The president’s disapproval score was recorded from a low of 51 percent (Rasmussen) to a high of 60 percent (YouGov for CBS; Premise).

Regardless of how the job approval research data may vary from day to day, it is curious to see just how these numbers compare with the historical presidential research. The Gallup data firm began presidential approval polling and has charted it ever since President Harry Truman began preparing for the 1948 national election.

According to the current Gallup data, last recorded on President Biden’s 918th day in office, 40 percent of the sampling universe graded him with a positive job approval score (Gallup only records the positive approval response on their historical chart).

Reviewing the 14 presidents from Truman through Biden, inclusive, we look at where certain other presidents stood at around this same time in their own administrations. Interestingly, three other presidents were within the same approval rating realm as Biden at this same approximate point in their presidencies. The three are: Donald Trump (42 percent at the 922nd day of his presidency); Barack Obama (42 percent; 929); and Ronald Reagan (44 percent; 923).

As you can see just from this group, presidential approval 18 or so months before the general election is not an absolute predictor as to whether the subject wins or loses the succeeding national election. Just from the above sample of three, we see one who lost (Trump) and two who won (Obama, Reagan). President Reagan, in fact, had the highest growth rate from his standing 923 days into his term to his final vote percentage of all 14 charted presidents (44 percent approval; 58.8 percent vote percentage in the 1984 election; a comparative gain of 14.8 percentage points).

This tells us that presidential job performance between the commensurate benchmark point in time and the election, and running a sound campaign, are far more important factors in determining presidential re-election outcome than job approval at this point in the term.

Interestingly, the three presidents with the highest approval rating at the commensurate benchmark who ran for re-election: George H.W. Bush (72 percent approval; 905th day in office); Dwight Eisenhower (72 percent; 910); and George W. Bush (62 percent approval; 900) were also the three who lost the most percentage points from their approval ratings in comparison to their ending vote percentage.

In fact, as we know, the leader at this commensurate point, George H.W. Bush with a 72 percent positive job approval, would go on to lose re-election with a finishing popular vote percentage 34.5 points lower than his approval score 18 months before the 1992 national vote. Both presidents Eisenhower and George W. Bush followed the same pattern, but not as dramatically. Eisenhower dropped 14.6 percent from his approval rating to final vote percentage, and Bush, 11.3 percent.

Overall, of the 14 presidents with recorded job approval scores throughout their tenure in office, seven won the succeeding election and four lost. Two — presidents John F. Kennedy and Lyndon Johnson — did not seek another term. Obviously, Kennedy had been assassinated, while Johnson declined to run.

Of the seven who won the succeeding election, four had positive job approval ratings approximately 18 months before the vote (Truman, Eisenhower, Richard Nixon, and George W. Bush), while three did not (Reagan, Bill Clinton, and Obama).

From the group of four presidents who lost the succeeding election, two had positive ratings approximately 900 days into their terms (George H.W. Bush and Gerald Ford), and two were in upside-down territory (Jimmy Carter and Trump).

Though President Biden has low approval ratings at this juncture, it is by no means certain that he will fail to win re-election in 2024. History tells us that any result can still happen.

Job Approval: A Poor Indicator

By Jim Ellis — Monday, May 8, 2023

President

Polling Numbers: The Good, The Bad & The Ugly — The Gallup organization last week released their historical comparison of commensurate modern-era presidential job approval ratings, and it appears that a high positive score is not necessarily a prerequisite for winning re-election; nor is a poor one a precursor for defeat.

Gallup listed the presidents from Joe Biden back through Dwight Eisenhower and captured their mean average job approval ratings from the period between January 20 and April 19 of the year prior to them seeking re-election. Presidents Gerald Ford, John Kennedy, and Lyndon Johnson are not included because they were either not in office during the sampled period (Ford) or did not seek re-election (Kennedy because he was assassinated, while Johnson chose not to run for a second full term).

Looking at the Gallup number for each tested president (the posted figure representing the average polling result for the number of surveys conducted during the aforementioned testing period), President Biden is the worst performer at 38.7 percent favorable; George H.W. Bush, at 82.7 percent, was rated the best.

As you can see solely from that data point, even having the best job performance rating in the early part of the year prior to re-election is no guarantee of winning. While Bush had one of the highest positive ratings on record, he would then post the lowest popular vote percentage (37.5) and the second-lowest electoral vote total (168) of the nine presidents who ran for re-election after 1950.

The reverse is true, as well. The second-worst job approval rating at a commensurate period in his presidency is Ronald Reagan’s 38.8 percent positive score. Reagan would then rebound to the point of recording the strongest re-election electoral vote total (525 of the 538 available votes) in modern political history, and the second-highest popular vote score at 58.8 percent. The only president who outperformed Reagan in terms of a percentage of aggregate votes recorded was Richard Nixon’s 60.7 percent in 1972. Less than two years later, however, Nixon would be forced to resign in disgrace over the Watergate scandal.

Of the nine presidents since 1950 who ran for a second term, six were re-elected (Eisenhower, Nixon, Reagan, Bill Clinton, George W. Bush, and Barack Obama). Three were defeated (Jimmy Carter, George H.W. Bush, and Donald Trump).

In terms of those defeated, Carter’s job approval rating during the tested period was 41.2 percent, Bushes, as cited above, was 82.7 percent, while Trump’s was 46.8 percent.

Interestingly, both Bush’s significantly under-performed in their re-elections. George H.W. Bush dropped 45.2 points from his job approval score in the first quarter of the year before re-election compared to his popular vote total. His son, George W. Bush, was second in this category. While winning a second term with 50.7 percent of the vote, he dropped 12.6 points from his average first quarter 2003 job approval score of 63.3 percent. President Carter came the closest between early job approval, 41.2 percent, and his re-election popular vote total, 41.0 percent. His 49 electoral vote total in 1980, however, was by far the worst among the tested presidents.

Among those 10 presidents, including Biden, the average approval rating is 51.8 percent positive, while the average succeeding popular vote total was 50.3 percent (54.6 percent among the six winning presidents; 41.8 percent among the three losing chief executives).

While it is obviously better to be in a stronger job approval position heading into an election, having an upside-down ratio is not always disastrous. Conversely, as we’ve seen from the Bushes, posting high approval ratings the year prior to re-election is also no guarantee of success at the ballot box.

The fact that President Biden is on the low end of the approval rating index at this point in his presidency is not necessarily a cause for panic for Democrats, nor is it an ironclad prediction factor that he will lose the 2024 election. It is an indication, however, that he will have to pick up the pace of creating a better image and improving his perceived success rate regarding the handling of key issues.

House of Reps Makeup Assessed; Crowded Candidate Field Already in Porter’s CA-47; GOP Leads in Nationwide Party ID in Gallup Poll

By Jim Ellis — Wednesday, Jan. 25, 2023

Elections

Reassessing Republican Performance — It is a common analysis that the Republicans under-performed in the 2022 election, but a closer inspection of the final US House results suggests such a conclusion may be somewhat unwarranted.

It is certainly clear that the Republicans fell below the congressional leadership and conservative media’s expectations, but the flaw may have been unrealistic predictions instead of candidates falling woefully short at the ballot box.

Several points lead to this new conclusion. 

First, the Daily Kos Elections blog conducted an analysis of all 435 districts once the 50 post-redistricting state maps were in place. The DK researchers calculated the 2020 Biden-Trump presidential results for all 435 congressional districts and found that the national Democratic nominee carried 226 seats from the grand total, therefore suggesting that the final redistricting maps actually favored the Democrats and not the Republicans.

Therefore, seeing 222 seats in a new Republican majority when the opposing party had the advantage in 226 seats possibly puts the final result in a different light. 

Secondly, the national congressional vote favored the Republicans by a 50.6 – 47.8 percent margin, a spread of some 3.04 million votes. Directly extrapolating this national congressional popular vote number with an overlay of the 435 seats would directly yield the majority party 221 seats. 

These latter figures tell us that the new redistricting maps accurately reflect the national vote count, at least in relation to the 2022 election. This, too, shows that the Republicans gaining 222 seats when their national vote would project to 221 was not the poor performance that many believe occurred.

Another common statement surrounding Republican 2022 performance in House races is the party left too many close contests “on the table.” The numbers pertaining to this observation also tell a different story.

In the 25 closest House races, Republicans won 15, including the five overall closest results. Looking at the 10 Democratic wins in this category, there is an argument to be made that the outcome could have realistically changed in only four of these hotly contested campaigns. Thus, if the Republicans won the reasonable “races on the table” their majority would have grown to only 226.

The six tightest races that statistics suggest should have gone to the Democrats are:

• NM-2: Las Cruces City Councilman Gabe Vasquez (D) defeated Rep. Yvette Herrell (R) due mainly to redistricting. The Democratic map drawers changed the 2nd CD from a seat that favored Republicans by 14 points to a new domain giving the Democrats a four point statistical advantage. These numbers are from the FiveThirtyEight data organization calculations. Therefore, the Democratic candidate scoring a 50.3 percent victory is actually a bit below what was expected.

• CT-5: Connecticut Rep. Jahana Hayes (D-Wolcott) won a third term, but in a closer-than-expected finish, taking just 50.4 percent of the vote in a seat rated D+3. Again, statistics suggest that this is a Democratic district, and especially so with an incumbent on the ballot.

• NY-18: Another district where the Democrats were favored (D+3) went to 19th District special election winner Pat Ryan (D-Gardiner). He defeated a strong Republican effort from then-state Assemblyman Colin Schmitt with only 50.6 percent of the vote.

• OR-6: The surprise of this race is how close Republican Mike Erickson came to scoring an upset victory in a district rated D+7. State Rep. Andrea Salinas (D-Tigard) won the election, but her 50.0 – 47.5 percent margin should have been greater.

• RI-2: Republicans had high hopes that former gubernatorial nominee Allan Fung could upset then-state Treasurer Seth Magaziner (D-Cranston) in a seat rated D+17. Such expectations proved unrealistic, but Fung did hold the new Congressman to only a 50.4 winning percentage.

• CA-47: Rep. Katie Porter (D-Irvine) was always favored to defeat former state Assemblyman Scott Baugh (R), and did so by a 51.7 – 48.3 percent vote spread. She outspent Baugh by a $25.7 million to $3.1 million ratio, thus overwhelming her opponent with resources.

The four races Republicans might have turned around were:
Continue reading

Winning vs. Ideology

By Jim Ellis

Nov. 21, 2019 — As the 10 Democratic presidential candidates again took the debate stage last night, this time from Atlanta, they all needed recognize a few things: They needed to walk a fine line. The contenders needed to carefully navigate between appealing to their party’s ideological base, which is key to winning the nomination, and preparing for the general election where a more centrist approach appears to be the probable course toward achieving national victory.

The Gallup organization just completed a new national survey (Nov. 1-14; 1,015 US adults from all 50 states and the District of Columbia, 437 self-identified Democrats and Independents who lean Democratic) that compared the importance between choosing an ideologically sound nominee with one who is best equipped to win the general election irrespective of where that individual stands on the party’s base issues.

Looking at the current results in the prism of Gallup asking the same questions of Republican respondents when President Obama was running for re-election in 2012, and a Democratic cell group when President George W. Bush was seeking a second term in 2004, this sample skews towards electability over ideology in the starkest proportion.

According to Gallup’s questions asked of Democrats and lean Democrats whether they believed it is more important to find a candidate who can unseat President Trump or one who agrees with the individual respondent on issues, by a margin of 60-36 percent the poll showed that the favored candidate would be the one having the best chance to win the November 2020 election.

In 2012, Republican responses to this choice involving replacing President Obama, surveyed in mid-September of 2011, leaned toward a candidate who could win over the ideologically pure contender in a 53-43 percent spread. Eight years earlier, when President Bush was seeking his second term, the ratio among Democrats at the end of 2003 was 50-44 percent in favor of ideology, but six weeks later, in early February 2004, the margin switched to 55-40 percent toward finding the candidate who was best equipped to unseat Bush.

Continue reading

Tracking Trump’s Approval Ratings
Against Electoral College Results

2016 Electoral College Results map (270toWin)


By Jim Ellis

Feb. 26, 2019 — Already beginning to project where the states might fall in the 2020 presidential election, the Gallup organization released a 50-state survey tracking study Friday that summarizes their cumulative research collected throughout the past year.

Gallup finds President Trump slightly improving his standing over a similar project conducted from their aggregate 2017 data. Meanwhile, the Civiqs polling organization projects, as do all other pollsters, that Trump’s job approval remains upside-down. In the good news category for the president, however, the latter organization finds that he is viewed more positively than either of the national political parties.

Nationally, Trump carries a 44:52 percent job approval ratio according to the Civiqs poll of registered voters (polled continually from Oct. 12, 2015-Feb. 23, 2019; 181,729 responses during that multi-year tracking period). The Democratic Party, however, posts a lesser 39:52 percent rating, while the Republican Party lags behind both the president and their political party counterpart. The GOP registers a poor 26:60 percent index.

But these numbers are not particularly unusual because the same trend among the three polling subjects has been consistent for many months. The more telling conclusion is that the deviation factor among the approval ratings has remained constant for well over a year, suggesting that the electorate continues locked in a highly polarized and negative status.

Continue reading

Democratic Enthusiasm: Overblown?

By Jim Ellis

Dec. 20, 2017 — In attempting to objectively look at the current electorate now one year before the next election, is Democratic enthusiasm about the party’s prospects of capturing the US House majority accurate or does their optimism exceed what the numbers actually say?

Several points need to be dispelled before examining the latest NBC News/Wall Street Journal national poll that gives the Democrats a 10-point advantage in the “enthusiasm gap.”

partisan polling splitFirst, let’s remember in looking at the current cycle’s House special election results that neither party lost a seat they previously held. This is particularly significant when Democrats use the argument in reference to the Kansas, Montana, and Georgia special elections that they over-performed even though failing to win any of the seats.

While they may have over-performed in relation to the Trump presidential percentage in Kansas and Montana, when looking back to the last time those particular seats were open the 2017 Republican special election performance was actually within the consistent realm. Therefore, as the Democratic strategists often say themselves, and correctly so, it is the Trump percentage that is generally the political anomaly and not the historical results.

” … a one-point victory in an election with such a flawed candidate, irrespective of Alabama’s voting history, simply cannot be considered the emerging beacon of a coming wave for the 2018 midterm elections.”

In Georgia, the Democrats and their allies spent a record $35 million on that particular special election campaign and still lost by four percentage points. The one seat where they unmistakably over-performed was the only special election where the party’s political apparatus didn’t target: the three-point Republican victory in the South Carolina electoral contest.

Continue reading