Tag Archives: California

Newsom Wins Recall; Other Elections

By Jim Ellis

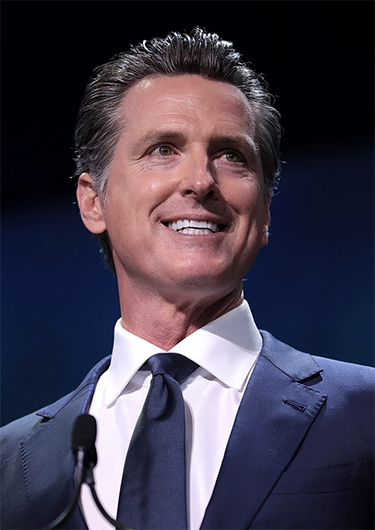
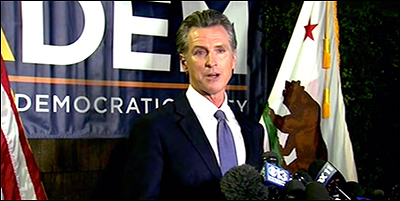
California Gov. Gavin Newsom (D)

Sept. 16, 2021 — California Gov. Gavin Newsom (D) easily avoided being recalled in last night’s statewide election, but the margin will likely close once all of the ballots are received and finally counted. The reported results are largely from mail ballots received well before election day. The posted turnout totals exceed 9 million voters, and this number will continue to grow.

The NO option on the recall ballot, meaning the vote individuals cast in order to keep Gov. Newsom in office, is running just under 64 percent, but under the California system of ballot signature verification it will be several weeks before we see official final totals. California also allows a long post-election period for ballots postmarked on election day to be received. It is clear, however, that Newsom will survive in office by a wide margin, but with an end-result closer margin than we see in early returns.

Though the replacement election became moot with the recall being rejected, conservative commentator Larry Elder was the clear leader, recording a tick under 47 percent of the vote. The next closest candidate was Democrat Kevin Paffrath with 10 percent. Former San Diego Mayor Kevin Faulconer (R) finished third with just under 9 percent. John Cox (R), who was one of the leading recall effort funders and the finalist against Newsom in the 2018 election, fell back to less than 4.5% of the vote. Media star Caitlin Jenner (R), who proved not to be a serious candidate, scored just 1.1% in the replacement election.

All of the replacement candidates were at a disadvantage in terms of financial resources. Though Elder raised a reported $18 million, an impressive amount in a short time frame, Gov. Newsom spent possibly as much as $80 million.

The rules for Newsom, however, were different. Because he was the recall subject, and the people were deciding the question as to whether or not he alone should remain in office, the campaign financial structure for him was that of a referendum. Therefore, he could raise unlimited amounts of money from individuals and entities. The replacement candidates, because they were running in an election campaign, were bound by the state campaign finance laws that feature contribution amount limits.


Continue reading →

The Lost California Seat

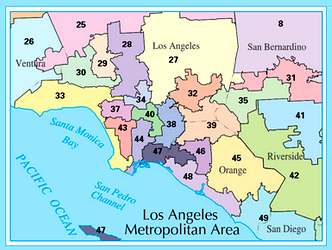
Los Angeles, California-area Congressional Districts


By Jim Ellis

Aug. 24, 2021 — Continuing our series about the states losing seats in reapportionment and which members might be on the outside looking in, today we analyze the Golden State of California. The largest US House delegation will downsize one seat, meaning it will send 52 members to the next Congress.

To put the California population change into historical perspective, during the 1980 census the state gained seven new US House seats. In the 2010 census, for the first time in history, California did not add, and now we see actual reduction.

For the second time, the California Citizens Redistricting Commission will draw the congressional map and under specific criteria. The districts are supposed to be constructed on a nonpartisan basis without regard to specific incumbents’ residences or political situation, adhere to the Voting Rights Act pertaining to their substantial number of majority minority districts, and keep cities and counties whole where possible.

Looking at the actual census population by district as opposed to the previously published census estimates, changes in which districts may be on the chopping block are evident. Under the estimates, it appeared that Rep. Adam Schiff (D-Burbank) was the low population CD, but his 28th District seat now is 12th from the bottom. The new low is veteran Rep. Lucille Roybal-Allard (D-Los Angeles), whose 40th District needs to gain 70,139 people.

Of the current 53 districts, 35 must gain population while 18 will shed; hence, the reason the state is losing a seat. From a county perspective, it appears the Los Angeles members will be most at risk. A total of 18 congressional districts encompass LA County including nine that are wholly-contained. The other nine districts cross county borders into such places as Kern, Orange, San Bernardino, and Ventura.

Of the 18 districts wholly or partially within the LA County borders, Democrats represent 15 and Republicans just three. Only one of these 18, the 23rd District of House Republican Leader Kevin McCarthy (R-Bakersfield), must shed population. Though certain other places in the state are also resident-low, there is a good possibility that the seat reduction will come from one of the Los Angeles districts, particularly among the nine seats wholly within the county since all of those contiguous seats must gain residents.

Continue reading →

Census by District

By Jim Ellis

Aug. 17, 2021 — We can now see exactly where each congressional district in the country stands in terms of population. The Census Bureau delivered the state redistricting data last week, and the Daily Kos Elections site data team segmented the numbers into individual congressional districts.

Below is a chart of the 38 states that have more than two districts, isolating the CDs that are the most over and under populated. The “High” column depicts the district that is the most over-populated in the state, while the “Low” is the one requiring the most new residents. The “+/-” column shows how many districts in the particular state are over and under populated.

The most robust district is that of Texas freshman Rep. Troy Nehls (R-Richmond). His southwest Houston seat houses just under one million people, at an exact count of 972,309. The least populated seat is West Virginia’s 3rd District (Rep. Carol Miller-R): 326,267 people under quota. With all of the Mountain State seats seriously down, it is clear as to why West Virginia lost a seat in reapportionment.

There are only two states, Colorado and Oregon, where all of the current districts are over-populated. Both entities gain one seat in reapportionment. On the other end of the spectrum, Michigan and Pennsylvania saw all districts falling below their new population quota, and in Illinois, 17 of their current 18 do as well. All three states are losing a district.

It is not surprising that California lost a seat for the first time in history. A total of 35 of their current 53 seats require more population versus 18 that must shed residents. New York barely lost a seat, by just 89 people statewide, which is surprising when seeing 23 of their current 27 districts requiring additional population.

The states are now converting their new data into their redistricting software systems. After that, most will hold hearings for public input prior to district construction beginning.

STATE DIST INCUMBENT HIGH LOW +/-
Alabama 5 Mo Brooks (R) 43,348 4, 3
7 Terri Swell (D) -53,143
Arizona 5 Andy Biggs (R) 86,414 3, 6
2 Ann Kirkpatrick (D) -50,133
Arkansas 3 Steve Womack (R) 86,266 2, 2
4 Bruce Westerman (R) -66,283
California 45 Katie Porter (D) 53,645 18, 35
-1 40 Lucille Roybal-Allard (D) -70,139
Colorado 4 Ken Buck (R) 148,823 7, 0
+1 3 Lauren Boebert (R) 36,543
Connecticut 4 Jim Himes (D) 25,627 2, 3
2 Joe Courtney (D) -21,288
Florida 9 Darren Soto (D) 186,381 21, 6
+1 13 Charlie Crist (D) -41,756
Georgia 7 Carolyn Bourdeaux (D) 94,304 8, 6
2 Sanford Bishop (D) -92,108
Illinois 7 Danny Davis (D) 10,986 1, 17
-1 17 Cheri Bustos (D) -79,907
Indiana 5 Victoria Spartz (R) 50,921 5, 4
8 Larry Bucshon (R) -38,579
Iowa 3 Cindy Axne (D) 61,382 1, 3
4 Randy Feenstra (R) -31,730
Kansas 3 Sharice Davids (D) 57,816 1, 3
1 Tracey Mann (R) -33,697
Kentucky 6 Andy Barr (R) 33,300 4, 2
5 Hal Rogers (R) -57,592
Louisiana 6 Garret Graves (R) 40,173 3, 3
4 Mike Johnson (R) -47,947
Maryland 4 Anthony Brown (D) 26,772 6, 2
7 Kweisi Mfume (D) -68,401
Massachusetts 7 Ayanna Pressley (D) 18,714 4, 5
1 Richard Neal (D) -50,635
Michigan 11 Haley Stevens (D) -17,368 0, 14
-1 5 Dan Kildee (D) -104,476
Minnesota 3 Dean Phillips (D) 24,586 5, 3
7 Michelle Fischbach (D) -39,978
Mississippi 4 Steven Palazzo (R) 37,196 3, 1
2 Bennie Thompson (D) -65,829
Missouri 3 Blaine Luetkemeyer (R) 35,121 6, 2
1 Cori Bush (D) -54,618
Nebraska 2 Don Bacon (R) 47,170 2, 1
3 Adrian Smith (R) -53,152
Nevada 3 Susie Lee (D) 79,374 2, 2
1 Dina Titus (D) -73,332
New Jerseyy 8 Albio Sires (D) 47,314 5, 7
2 Jeff Van Drew (R) -41,606
New Mexico 2 Yvette Harrell (R) 8,181 2, 1
1 Melanie Stansbury (D) -11,264
New York 12 Carolyn Maloney (D) 34,717 4, 23
-1 23 Tom Reed (R) -83,462
North Carolina 2 Deborah Ross (D) 165,703 12, 1
+1 1 G.K. Butterfield (D) -6,238
Ohio 3 Joyce Beatty (D) 23,119 2, 14
-1 6 Bill Johnson (R) -99,512
Oklahoma 1 Kevin Hern (R) 36,806 3, 2
2 Markwayne Mullin (R) -69,793
Oregon 1 Suzanne Bonamici (D) 157,843 5, 0
+1 4 Peter DeFazio (D) 117,399
Pennsylvania 10 Scott Perry (R) -5,379 0, 18
-1 15 Glenn Thompson (R) -90,540
South Carolina 1 Nancy Mace (R) 87,689 3, 4
6 Jim Clyburn (D) -84,741
Tennessee 4 Scott DesJarlais (R) 62,976 5, 4
9 Steve Cohen (D) -77,122
Texas 22 Troy Nehls (R) 205,322 28, 8
+2 13 Ronny Jackson (R) -59,517
Utah 4 Burgess Owens (R) 65,265 1, 3
3 John Curtis (R) -31,190
Virginia 10 Jennifer Wexton (D) 100,750 6, 5
9 Morgan Griffith (R) -87,917
Washington 7 Pramila Jayapal (D) 28,862 6, 4
6 Derek Kilmer (D) -33,730
West Virginia 2 Alex Mooney (R) -275,777 0, 3
-1 3 Carol Miller (R) -326,627
Wisconsin 2 Mark Pocan (D) 52,678 2, 6
4 Gwen Moore (D) -41,320

Newsom Recall Shock Poll

Embattled California Gov. Gavin Newsom (D)

By Jim Ellis

Aug. 10, 2021 — A stark new poll was released for the Sept. 14 California recall campaign, and the surprising results project Gov. Gavin Newsom (D) falling well behind in his battle to remain in office.

While several polls released in the past 10 days showed a weakening of Newsom’s position, the new Survey USA data (Aug. 2-4; 1,100 California adults, 888 registered California voters, 613 likely California recall election voters, 545 California voters who say they will answer the replacement candidate question; online) reveals a more extreme result.

Asked whether the sample of registered California voters would vote to recall the governor, for the first time, a 51 percent majority said they would. Those who support retaining him numbered only 40 percent.

Republicans, a distinct minority in the state but a more motivated group for this election, would vote to recall in an 8:1 ratio. Conversely, Democrats unsurprisingly favor retaining the governor, but by a smaller 3:1 ratio.

The S-USA poll sees a potentially very serious problem for Newsom in the independent category. By a 50-33 percent majority, the non-affiliated respondents would vote to remove him from office. Should this finding prove accurate, Newsom would be in danger of losing his position.

A major difference lies between those saying they are “certain” and “likely” to vote. The certain voters break 57-39 percent in favor of removal; the likely category: 43-36 percent for retention.

Differing patterns arise among racial segments. Whites heavily favor removal, 56-35 percent. Hispanics, by a 47-41 percent margin, do as well. Blacks and Asians are overwhelmingly in Gov. Newsom’s corner, however. Asians favor retention, 62-25 percent, while the small segment of blacks tested are virtually unanimous in their support for the governor.

Survey USA also segmented those claiming to be vaccinated, and those who do not. The unvaccinated, unsurprisingly, are overwhelmingly for the recall, 67-27 percent. Even a plurality of the vaccinated segment, however, also favors the recall: 47-43 percent.

The S-USA pollsters also identified reasons why those supporting the recall are doing so. Most of the responses center around how Newsom has handled the COVID-19 issue. A total of 34 percent said they are voting to recall because of “COVID issues.” Another 18 percent said the state spending is the main reason for their vote to remove Newsom. The unemployment compensation issue, and Newsom’s handling of it, was the significant reason motivating 12 percent of “yes” vote respondents (the position that supports removing the governor from office).

Continue reading →

Poll: Newsom in Trouble

By Jim Ellis

California Gov. Gavin Newsom (D)

July 30, 2021 — The University of California at Berkeley’s Institute of Governmental Studies released their latest Golden State survey that finds Gov. Gavin Newsom’s (D) strength in the upcoming recall election dissipating.

According to UC Berkeley, among likely voters, 47 percent would vote to recall Gov. Newsom and 50 percent would not, clearly the closest ballot test result seen to date. The recall election is scheduled for Sept. 14, and voters will first choose whether to remove the governor from office before choosing a replacement among 46 ballot qualified candidates. The replacement candidates’ votes count only if a majority supports removing the subject from office, in this case Gov. Newsom.

The Berkeley poll (July 18-24; 5,795 registered California voters; 3,266 likely California recall election voters, online) finds Newsom in trouble only among likely voters, those screened as almost certain to participate in the recall election. Within the entire polling sample, he returns to safe territory as the respondents break only 36-51 percent for removing him from office.

The major difference is partisanship. The parties, as one might guess, break in polarized fashion. A total of 91 percent of Democrats would vote against the recall while 95 percent of Republicans favor removal.

The independent and minor party sectors become interesting, however. Among the large No Party Preference group, 46 percent would vote to recall Newsom and 50 percent would not. The combined minor parties, which only account for approximately six percent of the electorate are breaking hard for the recall position. Within the minor party segment, 68 percent would vote to remove as compared to only 30 percent supporting the retain option.

Among Republicans, 90 percent say they are enthusiastic about the election, while 58 percent of Democrats say the same. Among the substantial segment in the “No Party Preference” or independent category, 53 percent say they are enthusiastic.

The polling analysis suggests that the governor’s fundamental problem is that Democrats are “almost unanimous” in their belief that he will win the recall election. This substantially explains the Democrats’ lack of solid enthusiasm for the irregular Sept. 14 stand-alone election.

Continue reading →

House Vulnerables – Part II

By Jim Ellis

July 13, 2021 — On Monday, we began a two-part series on what are arguably the most vulnerable dozen US House seats based upon the individual district’s political performance over the past two elections.

Below is the priority order update covering the second half of the top 12 most vulnerable CDs. As you will continue to see below, all of the seats except one are Republican held.

To refresh, the first six covered were:

• IA-2 (Rep. Mariannette Miller-Meeks, R-Ottumwa)
• IA-1 (Rep. Ashley Hinson, R-Marion/Cedar Rapids)
• IA-3 (Rep. Cindy Axne, D-Des Moines)
• FL-27 (Rep. Maria Elvira Salazar, R-Miami)
• CA-48 (Rep. Michelle Steel, R-Orange County)
• NY-22 (Rep. Cynthia Tenney, R-New Hartford)

Here’s our look at the next six:

UT-4: Rep. Burgess Owens (R-Salt Lake City) – Ave R vote: 48.8%
• Former NFL football star and businessman Burgess Owens defeated freshman Rep. Ben McAdams (D) by one percentage point in 2020, and we can expect another competitive race here again within this mostly suburban Salt Lake City congressional district located in the metropolitan area’s southern sector.

Republicans, who are in full control of the Utah redistricting process, will attempt to improve the district for Owens, which is possible since the 4th CD is the fastest growing district in the fastest growing state over the past decade. The best estimates suggest that the 4th District must shed approximately 50,000 people to other CDs. This should allow map drawers to subtract a substantial number of Democratic voters from the district, thus yielding Burgess a slightly more favorable political domain.

At this point, McAdams, who was the Salt Lake County mayor prior to his election to Congress, has not indicated whether he will return for a re-match.

MN-1: Rep. Jim Hagedorn (R-Rochester) – Ave R vote: 49.3%
• Two-term Rep. Hagedorn just announced that his cancer has returned, meaning an immediate treatment regimen. How this will affect his re-election campaign is yet to be determined. Hagedorn has won two close elections, as has his Democratic colleague in the adjacent district, Rep. Angie Craig (D-Eagan).

Minnesota is the only state in the nation that sees a split control legislature, meaning each party controls one house. Since the state did not lose a congressional district in apportionment as originally projected, it would not be surprising to see a legislative deal made where Democrats and Republicans are flipped between the two adjoining districts. The changes would result in Hagedorn gaining Republicans and Craig adding Democrats. Redistricting will perhaps be the most critical factor in determining the outcome of both districts come 2022 and beyond.

Continue reading →

California’s Lost Seat

By Jim Ellis

July 7, 2021 — For the first time in history, California loses a congressional seat in reapportionment, and the public input session that was scheduled to begin yesterday continues the California Citizens Redistricting Commission’s Phase 2 process. This week, the commission members continue listening to testimony about how the districts should be drawn for the state’s congressional delegation and both houses of the Golden State’s legislature.

Sitting adjacent to each other are the following California congressional seats: CA-32 (Rep. Grace Napolitano; D-Norwalk), CA-38 (Rep. Linda Sanchez; D-Whittier), CA-40 (Rep. Lucille Roybal-Allard; D-Downey), and CA-44 (Rep. Nanette Diaz-Barragan; D-San Pedro).

After California, along with the other 49 states, receives its census tract information after the Aug. 15 negotiated deadline, the five Democrats, five Republicans, and four non-affiliated CCRC members will study and organize the data until their Phase 3 line drawing process commences in September. The commission was created through a 2010 ballot proposition that removed redistricting power from the legislature and instituted a citizens panel to create the new post-census maps every 10 years. This is the body’s second redistricting cycle.

The commission timeline was crafted after the state of Ohio sued the Census Bureau to force a faster distribution of the state redistricting data. Originally, using COVID as their principal excuse, the Bureau leadership set Oct. 1 as their distribution deadline goal. In typical years, states would have received the census tract information months ago. The Ohio lawsuit was settled with the two sides agreeing on an Aug. 15 deadline that is now in effect for the whole country.

The commission members are now tasked with changing the state’s 53-member congressional delegation into a map that features only 52 seats. And now, the question of just which area will lose the district must be tackled.

Looking at the latest public district data, that through July 1, 2019, we see some patterns providing key clues. It is understood that the last year of the census is not included in these numbers, and reports suggest that the final 12 months of the 10-year cycle resulted in significant change for the state as the number of people leaving for other places substantially increased. In fact, for the first time, California actually has fewer people than it did in a preceding year.

The most significant loss appears to come in central Los Angeles County. Looking at the current 53 districts, the seat with the lowest population is Rep. Adam’s Schiff’s (D-Burbank) San Fernando Valley 28th CD. But the cluster of seats in the heart of Los Angeles suggests an area where two seats can easily be collapsed.

Continue reading →

SCOTUS Rules; Calif. Recall Scheduled

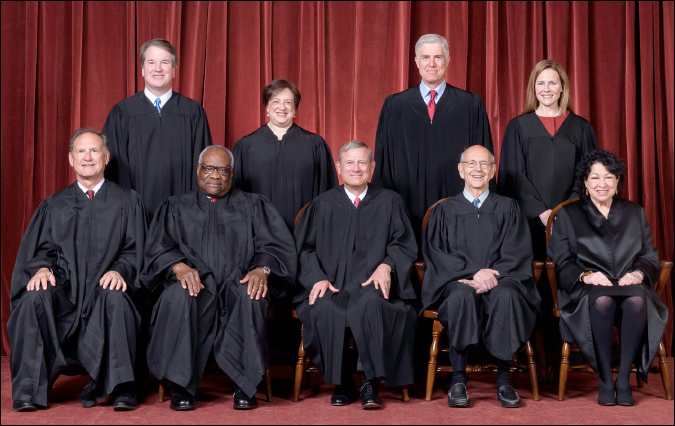
Current US Supreme Court

By Jim Ellis

July 6, 2021 — On their last day of the year’s early session last week, a Thursday, the Supreme Court of the United States issued rulings on the Arizona voting rights case and the California non-profit organization disclosure lawsuit.

In the Democratic National Committee v. Brnovich, the Supreme Court with Justice Samuel Alito writing for the 6-3 majority, ruled that the state of Arizona did not infringe upon minority voting rights or violate Section 2 of the Voting Rights Act in both prohibiting ballot harvesting with certain exceptions, and not counting provisional ballots cast from voters who do not reside in the particular precinct that the polling place covers.

The high court agreed with Arizona Attorney General Mark Brnovich’s (R) arguments that the laws are not racially motivated, nor do they intentionally discriminate against certain segments of the voting population, thus overturning the full 9th Circuit Court of Appeals ruling.

Originally in 2016, Brnovich won at the district court level and on the first appeal to a three-judge panel from the 9th Circuit. The DNC requested an en banc review of the original appellate ruling that agreed with Brnovich, and the entire 9th Circuit membership overturned the decision, siding with the plaintiff. At that point, AG Brnovich petitioned the Supreme Court, which agreed to hear the case. (Hearing cases en banc allows the full circuit court to overturn a decision reached by a three–judge panel. Due to the decreasing probability of U.S. Supreme Court intervention, the circuit court is often the court of last resort in the ordinary life of a case, thereby amplifying the importance of en banc review.)

In his ruling, Justice Alito stated that “every voting rule imposes a burden of some sort,” and that “mere inconvenience cannot be enough to demonstrate a violation of Section 2.” He also cautioned that, “what are at bottom very small differences should not be artificially magnified.”

While agreeing that holding free and open elections is a “valid and important state interest,” he also addressed the voter fraud argument, clearly stating that attempting to prevent such abuses is also a “strong and entirely legitimate state interest.”

In her article discussing these rulings, Supreme Court expert Amy Howe, in her Howe on the Court article that was published on the SCOTUS blog, offered that the Brnovich ruling “will make it more difficult to contest election regulations under the Voting Rights Act,” and thus likely means fewer voting rights cases coming through the courts. She further categorized this decision as a “major ruling.”

Continue reading →

Census Delays: Some Ramifications

By Jim Ellis

June 1, 2021 — As we know, the Census Bureau has delayed in meeting its public reporting deadlines, which causes ramifications in the political world. As a result, the state officials responsible for redistricting could well find themselves placed behind the proverbial eight ball as the new year approaches.

Reapportionment is the term used to explain the entire decennial process. Reapportionment, as the US Supreme Court defined it in their 1999 ruling on the US Census Bureau v. House of Representatives case, is basically divided into two parts. The first, which was finally completed and released on April 26, is the allocation of congressional seats to the states. The second is the re-drawing of congressional, state, and local district boundaries most often referred to as redistricting.

To complicate matters even further, the delayed allocation proved much different – affecting six seats to be exact – than predictions. It was believed for at least two years that Texas would gain three seats in the 2020 reapportionment and Florida two, with Arizona, Colorado, Montana, North Carolina, and Oregon adding one seat apiece. The actual numbers found Texas gaining two, Florida one, and Arizona none. The other one-seat gaining states were correctly predicted.

Conversely, Alabama, California, Illinois, Michigan, Minnesota, New York, Ohio, Pennsylvania, Rhode Island, and West Virginia were all expected to lose one seat apiece. The actual report found Alabama, Minnesota, and Rhode Island each retaining the same number of seats they held in the 2010 reapportionment, while the others did lose a single district apiece.

The Census Bureau claims that COVID is largely responsible for their delays, but the state of Alabama, in their pending lawsuit against the federal statistical entity, disagrees. Alabama claims the deadline violations occurred because of the Bureau’s attempt to impose, for the first time in history, differential privacy over the data. This means, under the argument of protecting individual privacy, data would be deliberately scrambled, and certain information not publicly released.

Differential privacy alone would make redistricting extremely difficult for state map drawers because the released census tract numbers, now by definition, wouldn’t equal the state population figures brought forth earlier in the year. The effect would cause political havoc throughout the country. A court ruling on the Alabama case is expected shortly.

Because of a successful legal challenge from Ohio, the Census Bureau has agreed to make the data necessary for redistricting available to the states by Aug. 15 instead of the Oct. 1 date indicated when allocation was announced.

Continue reading →

Examining California
Gov. Newsom’s Vulnerabilities

By Jim Ellis

California Gov. Gavin Newsom (D)

May 13, 2021 — The University of California at Berkeley’s Institute for Governmental Studies released another of its periodic polls this week, and while it finds Gov. Gavin Newsom (D) surviving the upcoming recall election it also identifies areas of underlying weakness.

According to the survey (April 29-May 5; 10,289 registered California voters with questions asked in English and Spanish, online), Gov. Newsom would win the impending recall vote as 49 percent of the respondents said they would vote to retain him in office and 36 percent support removal. Regarding his job approval and performance on certain issues, however, the poll identifies what could possibly become an opponent’s path to victory.

The Cal-Berkeley result is very similar to another poll conducted within the same time period. Survey USA went into the field during the April 30 – May 2 time segment and interviewed 750 California registered voters of which 642 were identified as likely to vote in the gubernatorial recall election. S-USA found the sampling universe broke 47-36 percent in favor of Gov. Newsom remaining in office, almost identical to Cal-Berkeley’s tally from their much larger online sample.

Cal-Berkeley delved deeper into how the respondent sample was viewing the governor’s job performance and his standing within the electorate, and its results suggest that a focused opposition campaign could yield a close outcome.

Perhaps most troubling to the Newsom strategy team is the question that tested enthusiasm within the electorate. While Democrats were breaking 75-8 percent to retain the governor, the enthusiasm metric showed that only 36 percent of them have a high interest in the election. Another 30 percent fell into a moderate interest level, and 34 percent of the self-identified Democratic voter base said they had little or no interest.

Republicans, on the other hand, registered a 75 percent high interest level, suggesting that their turnout for the eventual election will be much greater. Though Democrats hold a large 46-24 percent party registration advantage, the interest level suggests the eventual election result could fall into a closer range. Among GOP voters, the governor would be ousted in a whopping 85-8 percent margin.

Those registering under the No Party Preference category, who account for another 24 percent of the California voting universe, would retain the governor with a 45-33 percent margin, while the six percent who identify with a minor party break 48-29 percent for removal.

Overall, Gov. Newsom’s job performance improved from Cal-Berkeley’s late January poll and stands at a 52:43 percent positive to negative ratio. In January, the performance ratio was an upside-down 46:48 percent. This is largely due to improvement regarding his handling of the Coronavirus issue, as 45 percent rate his performance as excellent or good, while 35 percent say poor or very poor. Another 16 percent gave him a fair rating, which on this poll seems to indicate a moderate support level as opposed to leaning in a negative direction as some other pollsters characterize the term.

Continue reading →