Tag Archives: John F. Kennedy

Comparing Biden

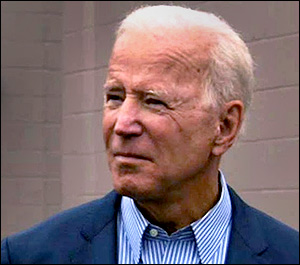
President Joe Biden / Photo by Gage Skidmore

By Jim Ellis — Thursday, Aug. 3, 2023

President

Polling: Biden at Lowest Job Approval Rating — News reports are quoting the recent CBS News poll from the YouGov international polling firm (July 26-28; 2,181 US adults; online) as giving President Joe Biden his lowest job approval rating to date. The CBS result found a whopping 60 percent saying they disapproved of the president’s performance in office.

Lately, presidential job approval polling is prevalent. Several firms, such as Morning Consult and Rasmussen Reports, track presidential job performance daily. Therefore, we frequently see a rather wide range of Biden performance ratings on a regular basis.

According to the FiveThirtyEight data organization, President Biden’s positive job approval response from July 26 through Aug. 1 ranged from 35 percent (Premise) all the way to 47 percent (Rasmussen Reports). The president’s disapproval score was recorded from a low of 51 percent (Rasmussen) to a high of 60 percent (YouGov for CBS; Premise).

Regardless of how the job approval research data may vary from day to day, it is curious to see just how these numbers compare with the historical presidential research. The Gallup data firm began presidential approval polling and has charted it ever since President Harry Truman began preparing for the 1948 national election.

According to the current Gallup data, last recorded on President Biden’s 918th day in office, 40 percent of the sampling universe graded him with a positive job approval score (Gallup only records the positive approval response on their historical chart).

Reviewing the 14 presidents from Truman through Biden, inclusive, we look at where certain other presidents stood at around this same time in their own administrations. Interestingly, three other presidents were within the same approval rating realm as Biden at this same approximate point in their presidencies. The three are: Donald Trump (42 percent at the 922nd day of his presidency); Barack Obama (42 percent; 929); and Ronald Reagan (44 percent; 923).

As you can see just from this group, presidential approval 18 or so months before the general election is not an absolute predictor as to whether the subject wins or loses the succeeding national election. Just from the above sample of three, we see one who lost (Trump) and two who won (Obama, Reagan). President Reagan, in fact, had the highest growth rate from his standing 923 days into his term to his final vote percentage of all 14 charted presidents (44 percent approval; 58.8 percent vote percentage in the 1984 election; a comparative gain of 14.8 percentage points).

This tells us that presidential job performance between the commensurate benchmark point in time and the election, and running a sound campaign, are far more important factors in determining presidential re-election outcome than job approval at this point in the term.

Interestingly, the three presidents with the highest approval rating at the commensurate benchmark who ran for re-election: George H.W. Bush (72 percent approval; 905th day in office); Dwight Eisenhower (72 percent; 910); and George W. Bush (62 percent approval; 900) were also the three who lost the most percentage points from their approval ratings in comparison to their ending vote percentage.

In fact, as we know, the leader at this commensurate point, George H.W. Bush with a 72 percent positive job approval, would go on to lose re-election with a finishing popular vote percentage 34.5 points lower than his approval score 18 months before the 1992 national vote. Both presidents Eisenhower and George W. Bush followed the same pattern, but not as dramatically. Eisenhower dropped 14.6 percent from his approval rating to final vote percentage, and Bush, 11.3 percent.

Overall, of the 14 presidents with recorded job approval scores throughout their tenure in office, seven won the succeeding election and four lost. Two — presidents John F. Kennedy and Lyndon Johnson — did not seek another term. Obviously, Kennedy had been assassinated, while Johnson declined to run.

Of the seven who won the succeeding election, four had positive job approval ratings approximately 18 months before the vote (Truman, Eisenhower, Richard Nixon, and George W. Bush), while three did not (Reagan, Bill Clinton, and Obama).

From the group of four presidents who lost the succeeding election, two had positive ratings approximately 900 days into their terms (George H.W. Bush and Gerald Ford), and two were in upside-down territory (Jimmy Carter and Trump).

Though President Biden has low approval ratings at this juncture, it is by no means certain that he will fail to win re-election in 2024. History tells us that any result can still happen.

Hispanics: A New Political Wild Card

By Jim Ellis — Thursday, June 29, 2023

Electorate

Mayra Flores

Hispanics: Swing Demographic — A new nationwide poll suggests the Hispanic community is now becoming much more of a swing demographic than its previous status as a homogenic Democratic voting bloc. While the Democrats still maintain majority support within Latino communities throughout the country, their margins are beginning to wane.

The Ipsos polling firm partnering with the Axios news service and Noticias Telemundo conducted an online nationwide poll of 1,116 Latino adults and registered voters over the June 2-9 period. Possibly the most surprising response is that a respondent plurality of 32 percent believes that neither party cares about them. A total of 30 percent say the Democrats care more about them, 11 percent believe Republicans do, another 11 percent say both do, and 15 percent did not respond for various reasons.

The Ipsos/Telemundo polling analysis further says that the Hispanic numbers are down considerably for Democrats when compared to historical trends. The study compares the 60 percent of the vote Latinos delivered for Democrats in 2022 to Presidents John F. Kennedy receiving 90 percent of the Latino vote in 1960, and Jimmy Carter attracting 82 percent Hispanic support in 1976. In 2022, Republicans garnered 39 percent of the Hispanic vote, which is a significant increase. Any time the Republicans reach 36 percent in this demographic category they are exceeding their national vote goal.

The analysis also points out that non-partisan Hispanic voters are outpacing those who choose a political party affiliation in Arizona, Florida, and Nevada. They are not alone, however, as the population at-large appears to be moving more toward Independent or non-affiliated political party status in most places but particularly the aforementioned.

The analysis also illustrates the fact that Hispanics are the fastest growing demographic group in the country, making them even more valuable as a voting center. The analysts quote US Census figures indicating that the entire US Latino population now exceeds 62 million, which is a whopping 23 percent growth factor in the decade ending in April of 2020.

The analysis also says that while Hispanics are gravitating more toward Republicans in Florida, they are still strongly Democratic in California and holding their own for Democrats in Texas. The analysts suggest, however, that Republicans under-performed among Hispanics in Texas, saying Democrats were able to hold “statewide and district” victories in critical places because of Hispanic loyalty.

The Texas analysis is flawed, however. There were 12 statewide races in the Lone Star on the 2022 ballot, including contests for state Supreme Court and the Court of Criminal Appeals. Republicans won all 12 with a very consistent voting pattern. GOP victories in the statewide contests ranged from just beyond 53 percent to just over 57 percent, while the Democrats consistently fell between 41 and 44 percent. These are typical Texas electoral results.

The one race they claim flipped to the Democrats in Hispanic South Texas was GOP Rep. Mayra Flores’ loss. The analysts did not complete their research. The contest Flores won in a 2022 special election was in a different district than her regular 2022 election campaign because of redistricting.

In the original 34th District, the FiveThirtyEight data organization found a partisan swing of D+5. In the new 34th, where she was paired with Democratic incumbent Vicente Gonzalez of McAllen, the Democrats gained 12 points on the same partisan lean scale to arrive at a D+17 figure. The final vote tally in favor of Rep. Gonzalez was 53-44 percent, which is in line with the traditional partisan voting pattern for such a district.

The Hispanic Republican swing in South Texas, however, is quite real. Of the five congressional districts that touch the Mexican border, Republicans now control two, and the third Democratic seat, the 28th District, is Rep. Henry Cuellar’s (D-Laredo) domain. He is generally regarded as the most conservative Democrat remaining in the House.

The overall premise of the Ipsos/Telemundo poll is that a much larger portion of the Hispanic vote is now more open to both parties. This development is an opportunity for Republicans, but it remains to be seen if the party can craft a series of messages that will convince a larger number of Hispanics to vote their way.

Together with the Asian population, Hispanics represent a Republican opportunity group that the party needs to offset its poor standing among suburban women and college educated voters, a latter trend that only seems to widen. If the GOP is successful in attracting more Latinos and Asians, 2024 could prove to be a watershed political realignment year.

Conflicting Electorate Clues

By Jim Ellis

President Joe Biden lingers at the bottom of presidential rankings after his first 100 days.

May 24, 2021 — Data points are routinely being published covering the electorate’s status, leading to various conflicting conclusions. This allows both Democrats and Republicans to promote favorable prediction trends for the 2022 elections.

Presidential job approval is often used as a key prediction benchmark. The Gallup Research organization pioneered presidential job approval tracking, beginning in the 1950s with President Dwight D. Eisenhower, and the tradition continues today.

During that approximate 70-year period, the average performance for a newly elected president in his first 100 days in office is 61 percent favorable. Only those presidents who were elected are included in the Gallup survey. This means that presidents Lyndon B. Johnson, who ascended to the office when John F. Kennedy was assassinated, and Gerald R. Ford, who became president when Richard M. Nixon resigned, are not included.

If you remove, however, the highest rated national leader, President Kennedy (81 percent approval) and the lowest, President Donald J. Trump (41 percent), the adjusted average climbs to 63 percent.

In his first 100 days, Gallup rates President Biden with a 57 percent approval figure, thereby placing him as only the 9th most popular of the 11 newly elected modern era chief executives.

The top three rated presidents in their first 100 days are Kennedy (81 percent), Eisenhower (74 percent), and Ronald Reagan (67 percent). The three lowest are presidents Trump (41 percent), Bill Clinton (55 percent), and Biden (57 percent).

Other surveys rate Biden’s performance somewhat lower, however. In the month of May, eight additional pollsters have tested the president’s job performance and found his favorable score in a tight range, from 51-54 percent with his disapproval percentage spanning from 35 to 48.

The generic polling question is one where a survey respondent is asked whether they would vote for the Republican or Democratic House of Representatives candidate. Right now, we’re seeing the generic numbers span the ideological spectrum, which tells us the great partisan divide is still very much alive. The left-leaning pollsters are seeing big leads for Democrats, while the more conservative-oriented pollsters find the responses very tight.

Continue reading

Massachusetts Primary Today

By Jim Ellis

Sept. 1, 2020 — A major political dynasty will end this evening. Today is Primary Day in Massachusetts and the long-awaited Democratic intra-party battle between two icons of Bay State politics, Sen. Ed Markey and Rep. Joe Kennedy III (D-Newton) will be decided.

Sen. Markey was first elected to the state legislature in 1972 and has served in elective office consecutively ever since. He spent four years in the state House of Representatives, 36 years in the US House, and was elected in a special US Senate contest in 2013 to replace then-Sen. John Kerry (D) who had resigned to become US Secretary of State in the Obama Administration. Markey was re-elected to a full term in 2014.

Rep. Kennedy is the grandson of Robert F. Kennedy, and thereby related to President John F. Kennedy, and the late Sen. Ted Kennedy (D-MA). He is the latest member of the famed Kennedy political dynasty. Joe Kennedy III was elected to the House in 2012, replacing retiring Rep. Barney Frank (D-Newton) in the district that contains the cities of Newton and Brookline before moving south to annex Taunton and Fall River. Should he lose tonight, he will be the first Kennedy not to win a Massachusetts campaign.

The race appeared close from the outset, but Sen. Markey appears to be pulling away in both campaign funds ($11.8 million raised through the pre-primary filing period on Aug. 12 to $8.8 million) and polling. Both see significant expenditure organizations conducting independent operations to support their Senate bids.

Since the end of July, Sen. Markey has pulled away. He has led in seven consecutive polls by an average of 8.7 percentage points after trailing in the early stages of the race. The latest poll, from Emerson College (Aug. 25-27; 453 likely Massachusetts Democratic primary voters) gives Sen. Markey a 56-44 percent lead when all respondents were prodded to make a choice. Interestingly, the last poll to find Rep. Kennedy leading also came from Emerson College during the early part of May. Those results show just how much the race has changed. Emerson previously projected Rep. Kennedy to a 58-42 percent advantage.

The Senate race is not the only major campaign on the Massachusetts ballot, however. House Ways & Means Committee chairman Richard Neal (D-Springfield) is striving to avoid becoming the ninth US House incumbent to be denied re-nomination in 2020. He faces a spirited challenge from Holyoke Mayor Alex Morse, who is hitting Rep. Neal from his left and criticizing him for being part of the “status quo.” Like the other Democratic upset winners this year, he Justice Democrats PAC has endorsed Morse, but their spending here appears less than the other campaigns in which they became involved.

Continue reading

The Presidential Debates Loom

By Jim Ellis

Sept. 1, 2020 — The Presidential Debate series looms on the political horizon, and controversy is beginning to swirl even though the first forum is still a month away.

The first in a series of currently three presidential debates is set for Sept. 29.

House Speaker Nancy Pelosi said last week that Democratic nominee Joe Biden shouldn’t debate President Trump. “I wouldn’t legitimize a conversation with him, nor a debate in terms of the presidency of the United States,” she was quoted as saying at a news conference.

At the end of July, former Bill Clinton news secretary Joe Lockhart wrote for CNN.com that Biden shouldn’t debate the president. “Whatever you do, don’t debate Trump. Trump has now made more than 20,000 misleading or false statements according to the Washington Post,” Lockhart penned as public advice to Biden.

Some on the Republican side argue that these Democratic leaders are beginning to lay the groundwork for Biden to avoid the debates because of concerns their candidate would fare poorly opposite President Trump.

For his part, Biden says he will debate the president, and become his own “fact checker on the floor.” He will also begin holding campaign events after Labor Day. In an Aug. 28 interview with the Associated Press, Biden said he’ll “meet people where it matters – not at irresponsible rallies or staged for TV to boost egos, but real people’s communities, in real local businesses, in their lives.” Biden further said he’ll “hold events consistent with the state rules about crowd sizes and other regulations.”

The first debate is scheduled for Tuesday, Sept. 29, the second on Thursday, Oct. 15, and the final forum culminates a week later on Oct. 22. The vice presidential debate between incumbent Vice President Mike Pence and Sen. Kamala Harris (D-CA) is scheduled for Wednesday, Oct. 7.

The debates have proven important in the past and always draw large audiences. According to the Pew Research Center, even the first televised debate, between then-Sen. John F. Kennedy and then-Vice President Richard Nixon, drew over 66 million viewers usually on black and white televisions, at a time when the US population was just under 181 million people, or approximately 55 percent of today’s total populace.

Continue reading

Ohio: Contrasting Polls

By Jim Ellis

state-of-ohio-mapNov. 1, 2018 — The Buckeye State of Ohio is viewed as one of the country’s quintessential swing states. In 2016, however, the state exceeded polling and even Republican expectations in their presidential vote, as President Trump won a decisive 52-44 percent victory over Hillary Clinton.

Some suggested the Trump vote was an indication that the state could be moving more definitively to the political right, but new surveys suggest the Buckeye electorate is returning to its previous swing vote history.

Still, Ohio proves a reliable national political barometer. In both 2008 and 2012, the electorate here voted for President Obama after twice after backing President George W. Bush in his two elections. The state previously favored President Bill Clinton in his two successful national campaigns. In fact, the last time Ohioans failed to vote for the winning presidential candidate came in 1960 when the state awarded its electoral votes to Republican Richard Nixon in his national losing effort against John F. Kennedy.

Two new polls were released this week that paint different pictures of the Ohio electorate’s current state. Some of the results are curious to the point of questioning the polling reliability or not being able to adequately determine how the governor’s race will end and failing to understand the wide discrepancy in US Senate polling projections.

Continue reading

Obama’s Job Approval: A Cause for Concern

Presidential job approval ratings can fluctuate widely based on a rather wide variety of factors. Among these are the status of the economy, whether the U.S. is at peace or war, the presence of real or suspected scandal, etc.

While President Barack Obama’s administration has been free of any significant scandal, the U.S. is currently engaged in somewhere between two and three wars, and is suffering from a painfully slow-growing economy and a 9.2 percent unemployment rate.

While the President’s approval rating has generally fluctuated in a relatively narrow band that has ranged from the mid-50s to the mid-40s for the last two years, the trend in recent weeks has become troubling for Democrats seeking office in 2012.

Yesterday’s daily Gallup presidential approval tracking poll shows Obama’s job approval rating now slipping to 39 percent. The Gallup poll takes a rolling three-day average of opinions expressed by 1,500 adults nationally. The margin of error in the survey is +/- three percent.

While Obama continues to receive broad support from African-Americans, his approval rating among Hispanics and whites has lingered at record lows in the past two weeks. Gallup noted that Obama’s approval rating among postgraduates and high-income Americans has seen a particularly steep decline since the late May-early June time period, which was the last time his average weekly job approval rating registered at least 50 percent.

At this stage of his presidency, Obama’s standing with Americans doesn’t compare very favorably with other post-WW II presidents. At the 940 days in office mark (Aug 20), here is how Obama compares to the other Presidents, since Harry S. Truman when polling of this type began:

  • Obama                  40%    Standing for re-election in 2012
  • Truman                54%    Re-elected in 1948
  • Eisenhower        71%    Re-elected in 1956
  • Kennedy              62%    Assassinated in 1963
  • Johnson              48%    Did not seek re-election in 1968
  • Nixon                   49%    Re-elected in 1972
  • Ford                      53%    Defeated for election 1976 (polled at 857 days in office)
  • Carter                   32%    Defeated for re-election in 1980
  • Reagan                 43%    Re-elected in 1984
  • Bush, G.H.W.    59%    Defeated for re-election in 1992
  • Clinton                 46%    Re-elected in 1996
  • Bush, G.W.         59%    Re-elected in 2004

Only Jimmy Carter fared worse than President Obama at this point in the term. The average for the 12 presidents after 940 days in office (857 for Ford) is 47.8%. Thus, Obama is almost eight percentage points below average at this point in time.

The low approval numbers do not mean that the President is doomed to lose his re-election campaign. History shows us that Presidents Nixon, Reagan, and Clinton were all below 50% approval but went on to win impressive re-election victories. In fact, historic landslides were even recorded for Nixon and Reagan. Conversely, two Presidents with some of the highest approval ratings, George H.W. and George W. Bush, both registering a strong 59% positive ranking at this commensurate time during their terms in office, did not fare as well in their re-election campaigns. As we know, George H.W. Bush was defeated for a second term, and his son won a close battle against a below average Democratic candidate.

While President Obama can certainly rebound and win a second term in office at the end of next year, the low approval ratings must be a cause for concern in his campaign camp. Watch for the President to make significant moves to improve his standing in the coming weeks.
___________________________________________________
For further detailed insights, to sign up for my daily email updates, or to sign up to track specific issues or industries, please contact me at PR***@pe*******************.com.