By Jim Ellis
July 23, 2018 — The Trafalgar Group surveyed the West Virginia US Senate campaign (July 13-16; 1,158 likely West Virginia general election voters) and tested — for what may be the first time any pollster has done so since President Trump officially nominated Appeals Court Judge Brett Kavanaugh to replace retiring Justice Anthony Kennedy — how the impending Supreme Court confirmation vote will affect a US Senate election.
Trafalgar’s initial ballot test response is consistent with other released polls regarding the race itself. That is, Sen. Joe Manchin (D) leads Attorney General Patrick Morrisey (R) 50-40 percent when the question is first posed. For the past month, all West Virginia surveys have delivered results in a similar range.

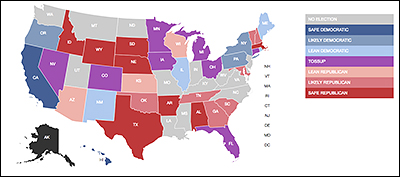
Polling chart courtesy Trafalgar Group. Click on the Trafalgar Group link or the graphic above to see more details.
At this point, the senator has not yet indicated how he will vote. Immediately after the nomination became public, Sen. Manchin stated that he wanted Judge Kavanaugh to complete the hearing process and publicly answer specific questions (Sen. Manchin is not a member of the Judiciary Committee).
According to Trafalgar, should he vote to confirm Judge Kavanaugh to serve on the Supreme Court, Sen. Manchin’s support within the electorate would substantially grow. However, if he opposes the judge, his campaign against Morrisey falls into the toss-up category.