Tag Archives: Michigan

Michigan’s Lost Seat

Michigan Congressional Districts

By Jim Ellis

Aug. 31, 2021 — Losing a congressional seat is nothing new to the Michigan delegation. Since the 1980 census, inclusive, the state has lost a district in every reapportionment and two in the 1990 iteration. Today, we continue our series about the states gaining and losing congressional districts under 2020 national reapportionment with a look at the Wolverine State.

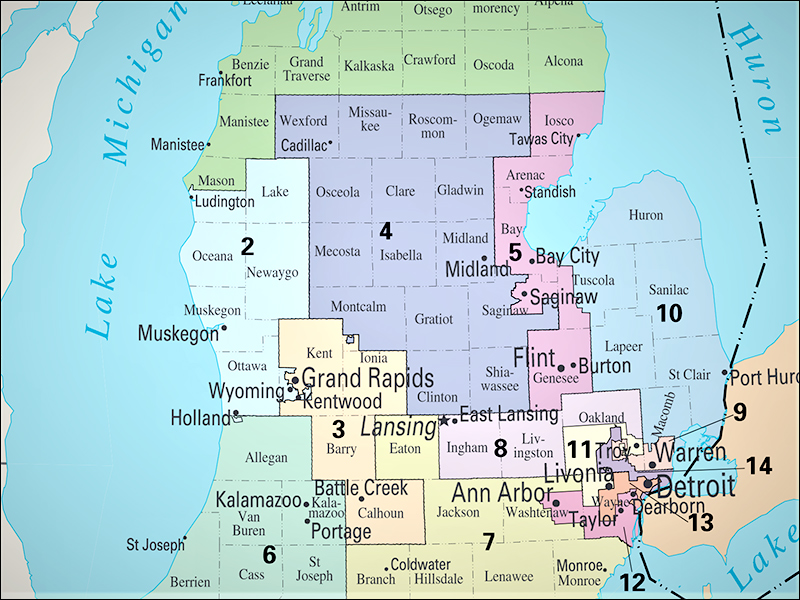
Michigan is difficult to draw not only because of the consistent seat losses, but so many of the state’s districts abut immovable objects: i.e., an international or state border, or a body of water. Under the current map, 10 of Michigan’s 14 congressional districts at least partially border a country, state, or lake.

The Michigan per district population number for the 2020 census is a high 775,179 individuals. High per district resident numbers often occur when a state loses a seat. In this case, all of Michigan’s 14 districts must gain population, hence the underlying reason for another delegation reduction.

Another factor in making the state a rather unique draw for the new Michigan Independent Citizens Redistricting Commission that is tasked with creating the new congressional map for the initial time, is the areas needing to gain the most population lie in opposite ends of the state. This, added to the fact that over 70 percent of the current districts border an immovable object, means the 2021 redistricting process is a significant challenge for the eleven commissioners (4R; 3D; 4N) with no previous experience in drawing political maps.

The area with the largest population shortfall comes in the northern part of the state. Rep. Dale Kildee’s (D-Flushing/Flint) 5th District is the seat furthest away from the population quota, down 104,476 individuals. Directly to his west, Rep. John Moolenaar’s (R-Midland) 4th District is 77,325 people under quota, and to the north all the way to the Canadian border, Rep. Jack Bergman’s (R-Watersmeet) Upper Peninsula 1st District will require an additional 70,829 residents. Combined, these three seats are 252,630 people short of the population quota for three congressional districts.

The area in the second-most need of population is the city of Detroit. The two districts that encompass the city, Districts 13 (Rep. Rashida Tlaib-D) and 14 (Rep. Brenda Lawrence-D) are a combined 184,290 people short for a pair of districts. Because both CDs 13 and 14 and majority minority seats, it is more than probable that the commission won’t collapse these districts because of Voting Rights Act requirements.

Continue reading

Census by District

By Jim Ellis

Aug. 17, 2021 — We can now see exactly where each congressional district in the country stands in terms of population. The Census Bureau delivered the state redistricting data last week, and the Daily Kos Elections site data team segmented the numbers into individual congressional districts.

Below is a chart of the 38 states that have more than two districts, isolating the CDs that are the most over and under populated. The “High” column depicts the district that is the most over-populated in the state, while the “Low” is the one requiring the most new residents. The “+/-” column shows how many districts in the particular state are over and under populated.

The most robust district is that of Texas freshman Rep. Troy Nehls (R-Richmond). His southwest Houston seat houses just under one million people, at an exact count of 972,309. The least populated seat is West Virginia’s 3rd District (Rep. Carol Miller-R): 326,267 people under quota. With all of the Mountain State seats seriously down, it is clear as to why West Virginia lost a seat in reapportionment.

There are only two states, Colorado and Oregon, where all of the current districts are over-populated. Both entities gain one seat in reapportionment. On the other end of the spectrum, Michigan and Pennsylvania saw all districts falling below their new population quota, and in Illinois, 17 of their current 18 do as well. All three states are losing a district.

It is not surprising that California lost a seat for the first time in history. A total of 35 of their current 53 seats require more population versus 18 that must shed residents. New York barely lost a seat, by just 89 people statewide, which is surprising when seeing 23 of their current 27 districts requiring additional population.

The states are now converting their new data into their redistricting software systems. After that, most will hold hearings for public input prior to district construction beginning.

STATE DIST INCUMBENT HIGH LOW +/-
Alabama 5 Mo Brooks (R) 43,348 4, 3
7 Terri Swell (D) -53,143
Arizona 5 Andy Biggs (R) 86,414 3, 6
2 Ann Kirkpatrick (D) -50,133
Arkansas 3 Steve Womack (R) 86,266 2, 2
4 Bruce Westerman (R) -66,283
California 45 Katie Porter (D) 53,645 18, 35
-1 40 Lucille Roybal-Allard (D) -70,139
Colorado 4 Ken Buck (R) 148,823 7, 0
+1 3 Lauren Boebert (R) 36,543
Connecticut 4 Jim Himes (D) 25,627 2, 3
2 Joe Courtney (D) -21,288
Florida 9 Darren Soto (D) 186,381 21, 6
+1 13 Charlie Crist (D) -41,756
Georgia 7 Carolyn Bourdeaux (D) 94,304 8, 6
2 Sanford Bishop (D) -92,108
Illinois 7 Danny Davis (D) 10,986 1, 17
-1 17 Cheri Bustos (D) -79,907
Indiana 5 Victoria Spartz (R) 50,921 5, 4
8 Larry Bucshon (R) -38,579
Iowa 3 Cindy Axne (D) 61,382 1, 3
4 Randy Feenstra (R) -31,730
Kansas 3 Sharice Davids (D) 57,816 1, 3
1 Tracey Mann (R) -33,697
Kentucky 6 Andy Barr (R) 33,300 4, 2
5 Hal Rogers (R) -57,592
Louisiana 6 Garret Graves (R) 40,173 3, 3
4 Mike Johnson (R) -47,947
Maryland 4 Anthony Brown (D) 26,772 6, 2
7 Kweisi Mfume (D) -68,401
Massachusetts 7 Ayanna Pressley (D) 18,714 4, 5
1 Richard Neal (D) -50,635
Michigan 11 Haley Stevens (D) -17,368 0, 14
-1 5 Dan Kildee (D) -104,476
Minnesota 3 Dean Phillips (D) 24,586 5, 3
7 Michelle Fischbach (D) -39,978
Mississippi 4 Steven Palazzo (R) 37,196 3, 1
2 Bennie Thompson (D) -65,829
Missouri 3 Blaine Luetkemeyer (R) 35,121 6, 2
1 Cori Bush (D) -54,618
Nebraska 2 Don Bacon (R) 47,170 2, 1
3 Adrian Smith (R) -53,152
Nevada 3 Susie Lee (D) 79,374 2, 2
1 Dina Titus (D) -73,332
New Jerseyy 8 Albio Sires (D) 47,314 5, 7
2 Jeff Van Drew (R) -41,606
New Mexico 2 Yvette Harrell (R) 8,181 2, 1
1 Melanie Stansbury (D) -11,264
New York 12 Carolyn Maloney (D) 34,717 4, 23
-1 23 Tom Reed (R) -83,462
North Carolina 2 Deborah Ross (D) 165,703 12, 1
+1 1 G.K. Butterfield (D) -6,238
Ohio 3 Joyce Beatty (D) 23,119 2, 14
-1 6 Bill Johnson (R) -99,512
Oklahoma 1 Kevin Hern (R) 36,806 3, 2
2 Markwayne Mullin (R) -69,793
Oregon 1 Suzanne Bonamici (D) 157,843 5, 0
+1 4 Peter DeFazio (D) 117,399
Pennsylvania 10 Scott Perry (R) -5,379 0, 18
-1 15 Glenn Thompson (R) -90,540
South Carolina 1 Nancy Mace (R) 87,689 3, 4
6 Jim Clyburn (D) -84,741
Tennessee 4 Scott DesJarlais (R) 62,976 5, 4
9 Steve Cohen (D) -77,122
Texas 22 Troy Nehls (R) 205,322 28, 8
+2 13 Ronny Jackson (R) -59,517
Utah 4 Burgess Owens (R) 65,265 1, 3
3 John Curtis (R) -31,190
Virginia 10 Jennifer Wexton (D) 100,750 6, 5
9 Morgan Griffith (R) -87,917
Washington 7 Pramila Jayapal (D) 28,862 6, 4
6 Derek Kilmer (D) -33,730
West Virginia 2 Alex Mooney (R) -275,777 0, 3
-1 3 Carol Miller (R) -326,627
Wisconsin 2 Mark Pocan (D) 52,678 2, 6
4 Gwen Moore (D) -41,320

Redistricting Is Now Underway

By Jim Ellis

Aug. 13, 2021 — Now four full months past the original deadline, the Census Bureau finally is scheduled to deliver to the states their census tract data, thus enabling the map-drawing process to begin.

While data was received yesterday, it will still be awhile before the public begins seeing even preliminary maps. The data must first be configured to the individual state’s redistricting software. Secondly, most state processes mandate hearings for public comment once the data is released. Each of these factors will happen prior to actual map construction. This notwithstanding, the critical element for each state, having the necessary data, is at long last occurring.

At the end of last year, we published a redistricting outlook that suggested Republicans, even though they control the process in a preponderance of states, could still find themselves down several seats in reapportionment and redistricting simply because of what could happen in the states that are gaining and losing congressional seats. (Go to: Ellis Insight Redistricting Outlook)

Some notable changes have occurred since the original piece was written, and now it appears the tables have turned toward the GOP as the party in best position to benefit nationally from the decennial district reconstruction process.

Below is a recap of the state situations that have changed:


Alabama: The original reapportionment prognostications suggested that Alabama would lose a congressional district. Republicans, because they control all but a Civil Rights-protected seat, were sure to take the loss. Likely due to a population surge in the latter part of the decade, Alabama did not lose a seat, thus the GOP saves a sure net loss.


Colorado: Though Colorado has adopted a redistricting commission for the first time, the swing toward the Democrats suggested that their party would gain the new seat. The Colorado commission is the first to release a congressional map, based upon Census Bureau estimates, and while the new 8th District looked solidly Democratic, the newly configured 7th District, currently Democratic, slightly favors the GOP.

Though this map is just a preliminary draw, should this be the direction in which the commission heads Republicans could actually reap a one seat gain when the 2022 election cycle concludes.


Continue reading

The Michigan Wild Card

Michigan Congressional Districts


By Jim Ellis

July 16, 2021 — For the third consecutive census, the Wolverine State of Michigan loses a congressional seat but this time it is more difficult to determine how the new map will be drawn and which of the state’s 14 US House members, comprised of seven Democrats and seven Republicans, will be the odd member out.

The big change is that for the first time a citizens’ commission, and not the state legislature, will draw the map. The 13-member commission has been conducting briefings to organizations around the state since April 3 and has public input meetings scheduled with those that began July 8 through Aug. 26.

What places Michigan in a wild card situation, however, won’t become clear until the US Census Bureau sends the state its individual tract data that will arrive on or around Aug. 15. At that point, the key question will be answered as to just how many people the city of Detroit has lost. This will be the critical factor in determining how the new congressional map is constructed.

Like every state, Michigan is bordered on all sides meaning the members with districts on the edge are typically in better defined position than those residing in the geographic middle. In this state’s case, the Great Lakes surround the split land masses on the north, east, and west, with Canada lying to its north and east, and Indiana and Ohio to the south.

Looking at the available public population data that only is current through July 1 of 2019, all current 14 districts must gain residents, hence the state losing a CD, with three most significantly holding the fewest people. Those three are the two Detroit seats, Districts 13 (Rep. Rashida Tlaib-D) and 14 (Rep. Brenda Lawrence-D), and the Flint-anchored seat, District 5 (Rep. Dan Kildee-D). All three are likely to need an influx of more than 100,000 people apiece.

Continue reading

Dueling Dual Polls

By Jim Ellis

Detroit Police Chief James Craig

June 14, 2021 — We open the week looking at conflicting polls from two Midwestern statewide races. The Michigan Republican Party published a survey that conflicts with earlier data we’ve seen about their state’s gubernatorial race, and the two leading Ohio Republican Senate contenders both released recent surveys that best tell their own campaign story.

In the Wolverine State, the Competitive Edge Research & Communication firm, polling for the Michigan Republican Party (May 26-June 4; 809 likely Michigan voters), projects retired Detroit Police Chief James Craig (R), who is soon expected to announce his bid for governor, leading incumbent Gretchen Whitmer (D) by a spread beyond the polling margin of error, 45-38 percent.

Curiously, the MIGOP leadership also released the ballot test that featured the party’s 2020 and 2018 US Senate nominee, John James. Here, the CERC finds Gov. Whitmer leading James, 50-45 percent. James has not indicated that he is going to enter the gubernatorial race, so it is surprising to see the Republican Party releasing data that puts one of their top political figures in a weaker position. James lost the 2020 Senate race to incumbent Gary Peters (D) by a tight 50-48 percent count.

In May, the Target Insyght survey research company (May 9-11; 800 registered Michigan voters) painted a different picture, forecasting a 48-42 percent lead for Gov. Whitmer over Craig and 49-39 percent against James.

The difference could be attributed to James retiring as chief of police after the TI poll was conducted and before the CERC survey was taken. Former chief Craig is a well-known and popular figure in Detroit, and the accolades given him for his tenure could certainly have helped his polling data at least on a short-term basis.

Additionally, Gov. Whitmer has been caught in several inconsistencies regarding her COVID shutdown policies, which were some of the most drastic in the country. More than once, she was found not following the letter of her own directives for herself and family.

Continue reading

Census Delays: Some Ramifications

By Jim Ellis

June 1, 2021 — As we know, the Census Bureau has delayed in meeting its public reporting deadlines, which causes ramifications in the political world. As a result, the state officials responsible for redistricting could well find themselves placed behind the proverbial eight ball as the new year approaches.

Reapportionment is the term used to explain the entire decennial process. Reapportionment, as the US Supreme Court defined it in their 1999 ruling on the US Census Bureau v. House of Representatives case, is basically divided into two parts. The first, which was finally completed and released on April 26, is the allocation of congressional seats to the states. The second is the re-drawing of congressional, state, and local district boundaries most often referred to as redistricting.

To complicate matters even further, the delayed allocation proved much different – affecting six seats to be exact – than predictions. It was believed for at least two years that Texas would gain three seats in the 2020 reapportionment and Florida two, with Arizona, Colorado, Montana, North Carolina, and Oregon adding one seat apiece. The actual numbers found Texas gaining two, Florida one, and Arizona none. The other one-seat gaining states were correctly predicted.

Conversely, Alabama, California, Illinois, Michigan, Minnesota, New York, Ohio, Pennsylvania, Rhode Island, and West Virginia were all expected to lose one seat apiece. The actual report found Alabama, Minnesota, and Rhode Island each retaining the same number of seats they held in the 2010 reapportionment, while the others did lose a single district apiece.

The Census Bureau claims that COVID is largely responsible for their delays, but the state of Alabama, in their pending lawsuit against the federal statistical entity, disagrees. Alabama claims the deadline violations occurred because of the Bureau’s attempt to impose, for the first time in history, differential privacy over the data. This means, under the argument of protecting individual privacy, data would be deliberately scrambled, and certain information not publicly released.

Differential privacy alone would make redistricting extremely difficult for state map drawers because the released census tract numbers, now by definition, wouldn’t equal the state population figures brought forth earlier in the year. The effect would cause political havoc throughout the country. A court ruling on the Alabama case is expected shortly.

Because of a successful legal challenge from Ohio, the Census Bureau has agreed to make the data necessary for redistricting available to the states by Aug. 15 instead of the Oct. 1 date indicated when allocation was announced.

Continue reading

Another Close Michigan Race

By Jim Ellis

Detroit Police Chief James Craig

May 18, 2021 — As it is becoming clear that retiring Detroit Police Chief James Craig (R) is preparing to challenge Michigan Gov. Gretchen Whitmer (D) next year, Target Insyght, polling for the Michigan Information & Research Service (MIRS), tested the potential general election pairing in a recent study. The results portend another tight Wolverine State campaign.

The TI poll (May 9-11; 800 registered Michigan voters, live interview) finds Gov. Whitmer leading Chief Craig by a six-point, 48-42 percent, spread. More importantly, the survey identified key areas of weakness for the governor, ones that could potentially allow a GOP contender to construct a reasonable path to victory. Chief Craig has not yet announced his candidacy but is expected to do so once he officially retires from the police force on June 1.

Where Chief Craig may have a significant advantage in such a race is his potential ability to draw more votes from the African American community particularly in heavily Democratic Detroit.

While President Biden averaged 79.1 percent of the vote in Congressional Districts 13 and 14 that encompass the city, the Target Insyght poll finds Gov. Whitmer pulling only 64 percent among black voters, while the outgoing police chief attracts 36 percent. In Detroit, 78.3 percent of the population is African American according to the latest publicly available Census Bureau estimates (July 2019).

Gov. Whitmer’s bigger weakness, however, lies in the area of jobs and rebuilding the state’s economy. According to this issue segmentation, voters would favor Chief Craig over Gov. Whitmer by a whopping 63-30 percent margin.

John James, the African American Republican who has run highly competitive campaigns in the last two consecutive Michigan Senate races, was also tested but he doesn’t perform as well as Chief Craig in a general election pairing. While the governor tops Chief Craig by six points, as mentioned above, James trails by 10 percentage points, 49-39 percent.

In the Republican primary, however, it is James who would have a clear advantage. If he and Chief Craig oppose each other for the 2022 GOP gubernatorial nomination, the former man would begin the race with a 36-21 percent advantage in the primary according to this particular survey.

Continue reading