
Tag Archives: Wisconsin

Census by District

By Jim Ellis

Aug. 17, 2021 — We can now see exactly where each congressional district in the country stands in terms of population. The Census Bureau delivered the state redistricting data last week, and the Daily Kos Elections site data team segmented the numbers into individual congressional districts.

Below is a chart of the 38 states that have more than two districts, isolating the CDs that are the most over and under populated. The “High” column depicts the district that is the most over-populated in the state, while the “Low” is the one requiring the most new residents. The “+/-” column shows how many districts in the particular state are over and under populated.

The most robust district is that of Texas freshman Rep. Troy Nehls (R-Richmond). His southwest Houston seat houses just under one million people, at an exact count of 972,309. The least populated seat is West Virginia’s 3rd District (Rep. Carol Miller-R): 326,267 people under quota. With all of the Mountain State seats seriously down, it is clear as to why West Virginia lost a seat in reapportionment.

There are only two states, Colorado and Oregon, where all of the current districts are over-populated. Both entities gain one seat in reapportionment. On the other end of the spectrum, Michigan and Pennsylvania saw all districts falling below their new population quota, and in Illinois, 17 of their current 18 do as well. All three states are losing a district.

It is not surprising that California lost a seat for the first time in history. A total of 35 of their current 53 seats require more population versus 18 that must shed residents. New York barely lost a seat, by just 89 people statewide, which is surprising when seeing 23 of their current 27 districts requiring additional population.

The states are now converting their new data into their redistricting software systems. After that, most will hold hearings for public input prior to district construction beginning.

STATE DIST INCUMBENT HIGH LOW +/-
Alabama 5 Mo Brooks (R) 43,348 4, 3
7 Terri Swell (D) -53,143
Arizona 5 Andy Biggs (R) 86,414 3, 6
2 Ann Kirkpatrick (D) -50,133
Arkansas 3 Steve Womack (R) 86,266 2, 2
4 Bruce Westerman (R) -66,283
California 45 Katie Porter (D) 53,645 18, 35
-1 40 Lucille Roybal-Allard (D) -70,139
Colorado 4 Ken Buck (R) 148,823 7, 0
+1 3 Lauren Boebert (R) 36,543
Connecticut 4 Jim Himes (D) 25,627 2, 3
2 Joe Courtney (D) -21,288
Florida 9 Darren Soto (D) 186,381 21, 6
+1 13 Charlie Crist (D) -41,756
Georgia 7 Carolyn Bourdeaux (D) 94,304 8, 6
2 Sanford Bishop (D) -92,108
Illinois 7 Danny Davis (D) 10,986 1, 17
-1 17 Cheri Bustos (D) -79,907
Indiana 5 Victoria Spartz (R) 50,921 5, 4
8 Larry Bucshon (R) -38,579
Iowa 3 Cindy Axne (D) 61,382 1, 3
4 Randy Feenstra (R) -31,730
Kansas 3 Sharice Davids (D) 57,816 1, 3
1 Tracey Mann (R) -33,697
Kentucky 6 Andy Barr (R) 33,300 4, 2
5 Hal Rogers (R) -57,592
Louisiana 6 Garret Graves (R) 40,173 3, 3
4 Mike Johnson (R) -47,947
Maryland 4 Anthony Brown (D) 26,772 6, 2
7 Kweisi Mfume (D) -68,401
Massachusetts 7 Ayanna Pressley (D) 18,714 4, 5
1 Richard Neal (D) -50,635
Michigan 11 Haley Stevens (D) -17,368 0, 14
-1 5 Dan Kildee (D) -104,476
Minnesota 3 Dean Phillips (D) 24,586 5, 3
7 Michelle Fischbach (D) -39,978
Mississippi 4 Steven Palazzo (R) 37,196 3, 1
2 Bennie Thompson (D) -65,829
Missouri 3 Blaine Luetkemeyer (R) 35,121 6, 2
1 Cori Bush (D) -54,618
Nebraska 2 Don Bacon (R) 47,170 2, 1
3 Adrian Smith (R) -53,152
Nevada 3 Susie Lee (D) 79,374 2, 2
1 Dina Titus (D) -73,332
New Jerseyy 8 Albio Sires (D) 47,314 5, 7
2 Jeff Van Drew (R) -41,606
New Mexico 2 Yvette Harrell (R) 8,181 2, 1
1 Melanie Stansbury (D) -11,264
New York 12 Carolyn Maloney (D) 34,717 4, 23
-1 23 Tom Reed (R) -83,462
North Carolina 2 Deborah Ross (D) 165,703 12, 1
+1 1 G.K. Butterfield (D) -6,238
Ohio 3 Joyce Beatty (D) 23,119 2, 14
-1 6 Bill Johnson (R) -99,512
Oklahoma 1 Kevin Hern (R) 36,806 3, 2
2 Markwayne Mullin (R) -69,793
Oregon 1 Suzanne Bonamici (D) 157,843 5, 0
+1 4 Peter DeFazio (D) 117,399
Pennsylvania 10 Scott Perry (R) -5,379 0, 18
-1 15 Glenn Thompson (R) -90,540
South Carolina 1 Nancy Mace (R) 87,689 3, 4
6 Jim Clyburn (D) -84,741
Tennessee 4 Scott DesJarlais (R) 62,976 5, 4
9 Steve Cohen (D) -77,122
Texas 22 Troy Nehls (R) 205,322 28, 8
+2 13 Ronny Jackson (R) -59,517
Utah 4 Burgess Owens (R) 65,265 1, 3
3 John Curtis (R) -31,190
Virginia 10 Jennifer Wexton (D) 100,750 6, 5
9 Morgan Griffith (R) -87,917
Washington 7 Pramila Jayapal (D) 28,862 6, 4
6 Derek Kilmer (D) -33,730
West Virginia 2 Alex Mooney (R) -275,777 0, 3
-1 3 Carol Miller (R) -326,627
Wisconsin 2 Mark Pocan (D) 52,678 2, 6
4 Gwen Moore (D) -41,320

Rep. Ron Kind to Retire

Wisconsin Rep. Ron Kind (D-La Crosse)

By Jim Ellis

Aug. 12, 2021 — Veteran Wisconsin Congressman Ron Kind (D-La Crosse) said Tuesday that 26 years in the House of Representatives will be enough. He told the covering reporters that he is “out of gas,” and will not seek re-election in 2022. Kind was first elected to his southwestern Badger State congressional district in 1996.

In his remarks, the congressman said he is ” . . . part of a dying breed in public service today in Washington and certainly in Madison — someone who tried to be reasonable, pragmatic, thoughtful, worked hard to try to find common ground with my colleagues, work in a bipartisan way to find bipartisan solutions for the challenges that we face.”

Wisconsin’s 3rd District is one of seven seats in the country that voted for ex-President Trump in both 2020 and 2016 (Trump ’20: 51-47 percent; Trump ’16: 49-45 percent) and elects a Democrat to the House. Kind’s 2020 election percentage margin, 51-49, was the closest of his long career. Over his 11 re-election campaigns not including 2020, the long-time incumbent averaged 64.8 percent of the general election vote.

Rep. Kind’s 2020 November opponent, retired Navy SEAL Derrick Van Orden (R), had already announced his return for a re-match and had raised just over $750,000 since the beginning of this year, holding more than $600,000 in his campaign account according to the June 30 financial disclosure report. Despite his retirement announcement, Kind had been active in raising money, bringing in over $630,000 since the beginning of the year and was in strong financial shape with just under $1.4 million in the bank at the June 30 reporting deadline.

Therefore, and considering his active work in the district this year, the retirement announcement comes as a surprise. Examining the district’s recent changing voting history, since the electorate posted 55 percent for President Obama in 2012 to Rep. Kind having a close re-election eight years later, WI-3 likely becomes the Republicans’ top national conversion target, at least for the short term.

The 3rd District sits in the far western corner of the state, beginning at the southwestern tip of the Wisconsin southern border, just across the Mississippi River from Dubuque, Iowa. It then travels northward up the Iowa and Minnesota borders to encompass its two population anchor cities of La Crosse and Eau Claire, that house just over 52,000 and 67,000 individuals, respectively. The district then moves east to capture some of the central Wisconsin rural areas.

Continue reading

WI-Senate: Lt. Gov. Announces

By Jim Ellis

Wisconsin Lt. Gov. Mandela Barnes

July 22, 2021 — As expected, Lt. Gov. Mandela Barnes (D) declared his candidacy Tuesday for a Wisconsin Senate seat. Incumbent Sen. Ron Johnson (R) has yet to say if he will seek a third term (when he first ran in 2010, he committed to serving only two terms) but there is no question whatever the senator decides that the Wisconsin race will be highly competitive and become a national campaign.

Before the eventual Democratic nominee even gets the opportunity to face Sen. Johnson, he or she must traverse a difficult primary battle that won’t conclude until August of next year. Already vying for the party nomination in addition now to Lt. Gov. Barnes are state Treasurer Sarah Godlewski, state Sen. Chris Larson (D-Milwaukee), Outagamie County Executive Tom Nelson, and Milwaukee Bucks basketball club senior executive and former Obama White House aide Alex Lasry. Still others may enter.

Wisconsin has been the site of very close election in the latter part of the decade. Two presidential campaigns and a gubernatorial race fell within one percentage point (2016 Presidential: Trump: 47.2 – 46.5 percent; 2020 Presidential: Biden 49.4 – 48.8 percent; 2018 Governor: Tony Evers-D: 49.5 – 48.4 percent; 2016 US Senate: Johnson: 50-47 percent), and another photo finish is expected for 2022.

Polling will again be another question mark since the survey research community’s joint record in Wisconsin has been poor since 2016.

In the Trump-Clinton race, pollsters ran 32 polls and Donald Trump led in none, yet he won the state. In the 2016 Senate race, Sen. Johnson was ahead only once in 29 public polls, yet claimed a three-point re-election victory when the actual votes were tabulated. Again, in the 2020 presidential race, while correctly predicting that Biden would carry Wisconsin, their average margin was way off the mark, finding the Democrat leading by a mean average of 6.7 percentage points in eight polls conducted after Oct. 20. The actual Biden victory margin was just beyond 22,000 votes.

Continue reading

2022: The Unannounced

By Jim Ellis

July 19, 2021 — The Fox News website ran a story late last week saying that there remain five in-cycle US senators who have not yet revealed their political plans for 2022. Below is a review of those senators’ political situations and clues that could provide a glimpse whether they are headed toward re-election or retirement.

The best hints will be forthcoming in a matter of days as the second quarter campaign financial disclosure reports will be released shortly on the Federal Election Commission website. Last Thursday was the deadline for filing the reports for the period covering April 1 through June 30.

The five senators, listed alphabetically by state are Sens. Lisa Murkowski (R-AK), Chuck Grassley (R-IA), John Thune (R-SD), Patrick Leahy (D-VT), and Ron Johnson (R-WI).


Sen. Murkowski:

State: Alaska
Appointed: 2002
Re-elected: 2004, 2010, 2016
Age at time of 2022 election: 65
Victory Margin 2016: 44.4 – 29.2%

Announced Major Opponents:
• Karl Speights (R) – Retired Air Force officer
• Kelly Tshibaka (R) – Former AK Administration Commissioner

It is assumed that Sen. Murkowski will run for re-election, though her return path to Washington may be a difficult one to traverse. Last night, her campaign spokesperson stated that the Senator’s second quarter disclosure report would show $1.15 million raised for the quarter with $2.3 million cash-on-hand. These are financial numbers that suggest she will seek re-election.

Alaska has changed its nominating system and will be the first state to adopt a “top four” primary procedure. Similar to California, Louisiana, and Washington that use the jungle primary format to send the top two candidates to the general election, Alaska will instead advance the top four from the slate primary. The change virtually ensures that Sen. Murkowski will not again lose the Republican primary as she did in the 2010 election. In that year, she was forced to run a highly efficient general election write-in operation to win her second full term.

Early polling numbers find Sen. Murkowski with very poor favorability numbers among Republicans and running a distant third behind Kelly Tshibaka (R), who is already the state Republican Party’s officially endorsed candidate. Dr. Al Gross (D), the 2020 Senate nominee, has not yet committed to running again, but he, too, runs ahead of the Senator in the previously released surveys.

While the top four system guarantees Sen. Murkowski will secure a ballot position for the general election, winning her re-election is in doubt.


Sen. Grassley:

State: Iowa
First Elected: 1980
Re-elected: 1986, 1992, 1998, 2004, 2010, 2016
Age at time of 2022 election: 89
Victory Margin 2016: 60.1 – 35.7%

Announced Major Opponents:
• Jim Carlin (R) – State Senator; former State Representative
• Glenn Hurst (D) – Minden City Councilman; Physician
• Dave Muhlbauer (D) – Ex-Crawford County Commissioner; Farmer

Last week Sen. Grassley stated that he would make his political plan public before Nov. 1. Despite his advanced age, it is presumed in all sectors now that Sen. Grassley will seek re-election. He has filed a 2022 campaign committee with the FEC, has a semi-updated website, and it will be interesting to see how active his fundraising became in the second quarter. His March 31 report revealed a cash-on-hand figure of $2.04 million to begin the re-election cycle.

Continue reading

Latest Senate News – Part II

By Jim Ellis

May 28, 2021 — Today, we complete our two-part series pertaining to the latest Senate happenings, covering the latter half of the alphabet from New Hampshire through Wisconsin.

• New Hampshire: If Gov. Chris Sununu (R) decides to challenge Sen. Maggie Hassan (D), then the Granite State will likely become the Republicans’ best national conversion opportunity. In the only two publicly released polls this year testing such a pairing, Gov. Sununu leads in both.

Though New Hampshire has trended more Democratic at the top of the ticket in the past few elections and President Biden scored a better than expected 53-45 percent win here in November, Gov. Sununu has claimed three consecutive elections, including a 65 percent victory last year. The governor indicated he will make a decision about a Senate challenge during the summer. Should Sununu not make the race, Sen. Hassan becomes a clear favorite to win a second term.

• North Carolina: In another key Republican open seat, the North Carolina race appears to feature tough primaries in both parties. For the Republicans, whose eventual nominee will attempt to hold retiring Sen. Richard Burr’s (R) seat, former Gov. Pat McCrory, Rep. Ted Budd (R-Advance), and ex-Rep. Mark Walker reside in the top tier, with the former state chief executive enjoying big leads in early polling.

For the Democrats, the primary appears to be winnowing down to a contest between former state Supreme Court Chief Justice Cheri Beasley, who lost her seat in November by just 401 votes statewide, and state Sen. Jeff Jackson (D-Charlotte).

This will be another toss-up, top-tier Senate race regardless of who emerges from each of the competitive nomination contests.

• Ohio: The Buckeye State’s open US Senate race is beginning to crystallize. The Democratic side is headed for consensus around US Rep. Tim Ryan’s (D-Warren/ Youngstown) candidacy.

The Republicans look to have at least four strong candidates, former Ohio Republican Party chair Jane Timken, ex-state Treasurer and 2012 US Senate nominee Josh Mandel, author J.D. Vance, and possibly state senator and Cleveland Indians baseball club co-owner Matt Dolan (R-Chagrin Falls).

Businessmen Michael Gibbons and Bernie Moreno are also announced candidates, but they appear as second-tier contenders at this time. US Rep. Mike Turner (R-Dayton) remains a potential candidate. It appears that former US representative and 2018 US Senate nominee Jim Renacci is moving toward a Republican primary challenge against Gov. Mike DeWine in lieu of again running for the Senate.

Continue reading

Rep. Murphy to Challenge Sen. Rubio

By Jim Ellis

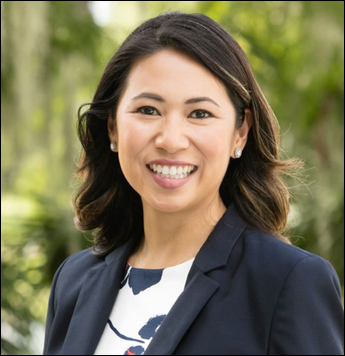
Florida Rep. Stephanie Murphy (D-Winter Park)

May 14, 2021 — According to the Axios news site, insiders close to Florida Rep. Stephanie Murphy (D-Winter Park) say that she has made the decision to challenge Sen. Marco Rubio (R) next year and will formally announce her campaign next month. The move had been expected for some time.

Rep. Murphy, a native of the country of Vietnam, was first elected to the House in 2016, defeating veteran Republican incumbent John Mica after the state Supreme Court had re-drawn the Florida congressional districts and made the 7th CD more Democratic. She unseated Rep. Mica 51-49 percent, and then scored re-election victories of 58 and 55 percent in 2018 and 2020, respectively.

A strong fundraiser, Rep. Murphy obtained over $3 million for both of her incumbent re-election campaigns. She ended the 1st quarter 2021 with a cash-on-hand figure of $1.43 million. Sen. Rubio posted $3.9 million in his campaign account during the same reporting period.

Assuming Murphy does enter the race next month, Democrats will have a credible challenger to Sen. Rubio, but one who still must be considered a decided underdog. In 2010, Sen. Rubio, then a state representative, defeated then-governor Charlie Crist, who was running as an Independent, and Democratic Congressman Kendrick Meek by a 49-30-20 percent margin. He was re-elected in 2016 with a 52-44 percent vote spread over then-congressman Patrick Murphy (D).

Florida races, as we know, are always competitive and usually very close, though the state has been trending more Republican over the past several elections. A Rubio-Stephanie Murphy race promises to become a national campaign.

With the Democrats apparently attracting a strong candidate in Florida, it is a good time to review the other key races.

In Pennsylvania, both parties are headed for very crowded primaries as each works to nominate a candidate to hopefully succeed retiring Sen. Pat Toomey (R). Afghan War veteran Sean Parnell entered the Republican primary earlier this week, but his only venture into elective politics was recording a two-point loss to Rep. Conor Lamb (D-Pittsburgh) last November in an Allegheny County suburban district.

Rep. Lamb, himself, may join the Democratic Senate campaign, meaning both parties are going to host political dogfights for the party nomination. In any event, however, the Pennsylvania race will be a top-tier national campaign.

Continue reading

A Wisconsin Senate Struggle:
Sen. Ron Johnson Trailing … Again

By Jim Ellis

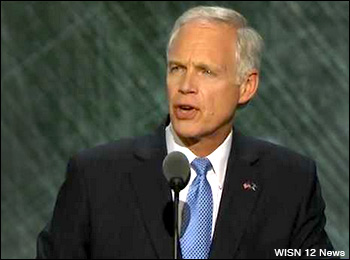
Wisconsin Sen. Ron Johnson (R)

April 5, 2021 — Another tough statewide campaign appears to be brewing in the Badger State.
Thomas Nelson is the Outagamie County, Wisconsin, executive (Appleton area) and a former Wisconsin state assembly majority leader who is assessing his chances of challenging Sen. Ron Johnson (R) next year. For his part, Sen. Johnson has not indicated whether he will seek a third term. He has hinted both toward running again and keeping the pledge he made during his first campaign in 2010 to serve only two terms.

Nelson just released the results of an internal Change Research poll that posts him to a four-point 48-44 percent lead over Sen. Johnson. Looking back to the senator’s last election campaign (2016), trailing in a survey is nothing new. It was the repetitive data continually pegging him as trailing that led to the National Republican Senatorial Committee abandoning him as a lost cause until the late polls showed him rebounding with at least a chance to win.

In the end, Johnson defeated former Sen. Russ Feingold (D), 50-47 percent, in one of the most surprising results of campaign year 2016.

Wisconsin is likely the least accurately polled state during the past few elections. In the aforementioned Johnson-Feingold race, a total of 74 surveys were publicly released, and 70 of them showed Sen. Johnson trailing. In the same election year, 33 research studies were placed in the public domain for the presidential race and only the Trafalgar Group, just as the campaign was closing, correctly projected Donald Trump with an edge.

In 2020, a total of 70 presidential polls were released and 66 gave Joe Biden the lead. He did carry the state, but only by 20,682 votes translating into a 0.7 percent margin. The final 20 polls, all conducted after Oct. 1, found President Biden carrying a 7.0 percent average advantage, well beyond the polling margin of error in relation to the final result.

Therefore, with a consistent pattern of underestimating Republican strength, seeing Sen. Johnson trailing by only four points in the early stages of the 2022 campaign suggests his actual standing is likely much better.

Continue reading

Ohio Sen. Portman to Retire

By Jim Ellis

Ohio Sen. Rob Portman (R) surprisingly announced his retirement Monday.

Jan. 27, 2021 — Ohio Sen. Rob Portman (R) surprisingly announced Monday that he will not seek a third term next year, opening the third Senate seat for the 2022 election cycle.

Addressing reporters at a news conference in Cincinnati yesterday, Sen. Portman said, “Our country’s polarized right now. It’s kind of shirts and skins. That makes it more difficult to find that common ground. Elected officials aren’t rewarded for that. What they’re rewarded for is throwing red meat to the talk show.”

The two-term senator indicated that the “partisan gridlock” is one of the reasons for his retirement. He further said in explaining his retirement decision, “we just keep pushing out to the right and to the left, there’s not going to be much left in the middle to solve the real problems we face.”

For the Republicans, they now have three big state open seats to defend as Sen. Portman joins Pennsylvania GOP Sen. Pat Toomey and North Carolina’s Richard Burr as incumbents who have already made their 2022 retirement plans public. Several others could be on the horizon.

Senators Richard Shelby (R-AL) and Chuck Grassley (R-IA) will be 88 and 89 years of age, respectively, at the time of the next election, and Wisconsin Sen. Ron Johnson (R) originally took a two-term pledge when he was first elected in 2010. None of these three lawmakers have made their future political plans public to date, however.

Ohio, once a bedrock Republican state, developed a swing image beginning in 1992 when the state deserted GOP President George H.W. Bush and backed Democrat Bill Clinton. They did so again in 1996. In 2000 and 2004, Ohio returned to the Republican column awarding George W. Bush with its electoral votes. In 2008 and 2012, the Buckeye State ventured back to the Democratic side of the political ledger, supporting Barack Obama in both of his national elections.

Therefore, rather than being cast as a swing state during this 20 year period, Ohio may actually have been a microcosm of the national electorate since the state’s voters chose the winning candidate in each of the presidential elections during that time span, and had done likewise for the three previous decades.

Continue reading

Early House Outlook – Part II

By Jim Ellis

Jan. 21, 2021 — Continuing with our electoral stage preview for the US House, today we look at 12 states in the country’s central region. Tomorrow and the following Monday, we move further east.


• Arkansas – 4 Seats (4R)

Arkansas holds four Republican districts, and the GOP controls the redistricting pen. They will obviously attempt to draw a new map that protects all four incumbents, and they should be able to do so with relative ease as the state continues to move toward the ideological right.

Arkansas had previously received Justice Department approval to draw a map where all of its 75 counties whole within the individual congressional districts, and thus exceeding the plus-or-minus one individual congressional district population variance requirement.


• Iowa – 4 Seats (1D3R)

Iowa has a hybrid redistricting system. The legislature voluntarily cedes power to a particular legislative committee, which then draws the four congressional districts based upon a mathematical population algorithm without regard to incumbent residences or political preferences. The legislature must then approve or reject the map without amendment.

The current map has produced competitive districts as is evidenced in the 2nd District being decided by just six votes in the 2020 election. Three of the state’s four CDs have seen both Republican and Democratic representation during this decade. It is likely we will see the process produce a similar map later this year.


• Kansas – 4 Seats (1D3R)

Both parties have seats at the redistricting table as Republicans control the state House and Senate while Democrats have the governorship. Republicans will attempt to at least protect the status quo but Democratic Gov. Laura Kelly can be expected to hold out for a 2R-2D plan. Any prolonged impasse will send the map to either a state or federal court in order to produce an interim map for the coming 2022 election.


• Louisiana – 6 Seats (0D4R; 2 Vacancies)

The more immediate political task Louisiana sees is filling its two vacant congressional districts. The New Orleans-Baton Rouge 2nd District has no representation because Rep. Cedric Richmond (D-New Orleans) resigned to accept a White House appointment from the Biden Administration. Rep-Elect Luke Letlow (R) tragically passed away after his election and before he was officially sworn into office. Therefore, both seats will be filled in a two-tiered March 20/April 24 special election calendar.

Republicans control the legislature, but Gov. John Bel Edwards (D) holds the veto pen. The number of seats will remain constant since the population appears relatively even through the state’s six districts. The 1st (Rep. Steve Scalise-R) and the 6th (Rep. Garret Graves-R) are over-populated while the 4th (Rep. Mike Johnson-R) and the 5th (Letlow vacancy) will need to gain residents.
Continue reading

Comparing 2020 & 2016

By Jim Ellis

Jan. 15, 2021 — Now that the presidential numbers are final and certified in all 50 states, we can begin to draw comparisons between the two Trump election years and see the states where movement was most significant.

The 2020 election results show interesting parallels in the race between President Donald Trump and President-Elect Joe Biden and the 2016 race between Trump and Hillary Clinton.

A total of 158,507,118 people are recorded as voting in the 2020 election, an all-time record. In 2016, by comparison, 136,792,535 individuals cast ballots. The current total represents an increase of 15.9 percent. Even those forecasting a turnout of just above 155 million, which seemed outlandish at the time, were low as the 2020 aggregate final vote widely cleared all previous electoral participation records.

As you will see from the following charts, most states performed similarly in 2020 as they did in 2016. In the preponderance of places, both President Trump and President-Elect Joe Biden posted better percentages in 2020, though Trump recorded slightly lower 2020 percentages in 13 states as compared to Biden falling below 2016 Democratic nominee Hillary Clinton in only one (Mississippi).

The change factors are largely due to lesser independent and minor party candidates on the 2020 ballot as opposed to 2016 and an increase in first-time voters.

Nationally, as determined in all 50 states, President Trump’s numbers increased an average of one percentage point per state, while Biden saw a mean average four percent jump over Clinton’s standing.

The first charts depict President Trump’s state totals in alphabetical order. To reiterate, his per state average gain was 1.0 percent. The second chart shows the states in order of the largest gains.

The succeeding Democratic charts illustrate Biden’s increased performance over that of Clinton. Though his national per state victory margin over President Trump was low in comparison to 2016 – changing Arizona, Georgia, Wisconsin and the 2nd District of Nebraska would have changed the national outcome and the aggregate vote margin was only 65,009 – his standing in every state was significantly better than hers. The Biden average per state gain was 4.0 percent.

REPUBLICAN

Alphabetical

STATE 2016 R 2020 R AVG GAIN
Alabama 62.1% 62.3% 0.2%
Alaska 51.3% 52.8% 1.5%
Arizona 48.7% 49.1% 0.4%
Arkansas 60.6% 62.4% 1.8%
California 31.6% 34.3% 2.7%
Colorado 43.2% 41.9% -1.3%
Connecticut 40.9% 39.2% -1.7%
Delaware 41.7% 39.8% -1.9%
Florida 49.0% 51.2% 2.2%
Georgia 50.8% 49.2% -1.6%
Hawaii 29.4% 33.9% 4.5%
Idaho 59.3% 63.8% 4.5%
Illinois 38.8% 40.6% 1.8%
Indiana 56.9% 57.0% 0.1%
Iowa 51.2% 52.8% 1.6%
Kansas 56.6% 56.2% -0.4%
Kentucky 62.5% 62.1% -0.4%
Louisiana 58.1% 58.5% 0.4%
Maine 43.5% 43.6% 0.1%
Maryland 33.9% 32.2% -1.7%
Massachusetts 32.3% 39.1% 6.8%
Michigan 47.6% 47.8% 0.2%
Minnesota 44.9% 45.3% 0.4%
Mississippi 57.9% 41.1% -0.3%
Missouri 56.8% 56.8% 0.0%
Montana 56.2% 56.9% 0.7%
Nebraska 58.7% 58.2% -0.5%
Nevada 45.5% 47.8% 2.3%
New Hampshire 46.5% 45.4% -1.1%
New Jersey 41.4% 41.4% 0.0%
New Mexico 40.0% 43.5% 3.5%
New York 36.1% 37.5% 1.4%
North Carolina 49.8% 49.9% 0.1%
North Dakota 65.1% 31.8% 2.1%
Ohio 51.7% 53.3% 1.6%
Oklahoma 65.3% 65.4% 0.1%
Oregon 40.4% 56.5% 0.7%
Pennsylvania 48.6% 48.8% 0.2%
Rhode Island 38.9% 38.6% -0.3%
South Carolina 54.9% 55.1% 0.2%
South Dakota 61.5% 61.8% 0.3%
Tennessee 60.7% 60.7% 0.0%
Texas 53.2% 52.1% -1.1%
Utah 45.5% 58.1% 12.6%
Vermont 29.8% 30.9% 1.1%
Virginia 44.4% 44.0% -0.4%
Washington 36.8% 38.8% 2.0%
West Virginia 68.6% 68.7% 0.1%
Wisconsin 47.2% 48.8% 1.6%
Wyoming 67.4% 69.5% 2.1%

Performance Increase

STATE 2016 R 2020 R AVG GAIN
Utah 45.5% 58.1% 12.6%
Massachusetts 32.3% 39.1% 6.8%
Hawaii 29.4% 33.9% 4.5%
Idaho 59.3% 63.8% 4.5%
New Mexico 40.0% 43.5% 3.5%
California 31.6% 34.3% 2.7%
Nevada 45.5% 47.8% 2.3%
Florida 49.0% 51.2% 2.2%
North Dakota 65.1% 31.8% 2.1%
Wyoming 67.4% 69.5% 2.1%
Washington 36.8% 38.8% 2.0%
Arkansas 60.6% 62.4% 1.8%
Illinois 38.8% 40.6% 1.8%
Iowa 51.2% 52.8% 1.6%
Ohio 51.7% 53.3% 1.6%
Wisconsin 47.2% 48.8% 1.6%
Alaska 51.3% 52.8% 1.5%
New York 36.1% 37.5% 1.4%
Vermont 29.8% 30.9% 1.1%
Oregon 40.4% 56.5% 0.7%
Montana 56.2% 56.9% 0.7%
Arizona 48.7% 49.1% 0.4%
Louisiana 58.1% 58.5% 0.4%
Minnesota 44.9% 45.3% 0.4%
South Dakota 61.5% 61.8% 0.3%
Alabama 62.1% 62.3% 0.2%
Michigan 47.6% 47.8% 0.2%
Pennsylvania 48.6% 48.8% 0.2%
South Carolina 54.9% 55.1% 0.2%
Indiana 56.9% 57.0% 0.1%
Maine 43.5% 43.6% 0.1%
North Carolina 49.8% 49.9% 0.1%
Oklahoma 65.3% 65.4% 0.1%
West Virginia 68.6% 68.7% 0.1%
Missouri 56.8% 56.8% 0.0%
New Jersey 41.4% 41.4% 0.0%
Tennessee 60.7% 60.7% 0.0%
Mississippi 57.9% 41.1% -0.3%
Rhode Island 38.9% 38.6% -0.3%
Kansas 56.6% 56.2% -0.4%
Kentucky 62.5% 62.1% -0.4%
Virginia 44.4% 44.0% -0.4%
Nebraska 58.7% 58.2% -0.5%
New Hampshire 46.5% 45.4% -1.1%
Texas 53.2% 52.1% -1.1%
Colorado 43.2% 41.9% -1.3%
Georgia 50.8% 49.2% -1.6%
Connecticut 40.9% 39.2% -1.7%
Maryland 33.9% 32.2% -1.7%
Delaware 41.7% 39.8% -1.9%

DEMOCRAT

Alphabetical

STATE 2016 D 2020 D AVG GAIN
Alabama 34.4% 36.6% 2.2%
Alaska 36.5% 42.8% 6.3%
Arizona 45.1% 49.4% 4.3%
Arkansas 33.6% 34.8% 1.2%
California 61.7% 63.5% 1.8%
Colorado 48.2% 55.4% 7.2%
Connecticut 54.6% 59.2% 4.6%
Delaware 53.1% 58.7% 5.6%
Florida 47.8% 47.9% 0.1%
Georgia 45.6% 49.5% 3.9%
Hawaii 61.0% 63.1% 2.1%
Idaho 27.5% 33.1% 5.6%
Illinois 55.8% 57.5% 1.7%
Indiana 37.8% 41.0% 3.2%
Iowa 41.7% 3.2% 3.0%
Kansas 36.0% 41.6% 5.6%
Kentucky 32.7% 36.1% 3.4%
Louisiana 38.4% 39.8% 1.4%
Maine 46.4% 52.5% 6.1%
Maryland 60.3% 65.4% 5.1%
Massachusetts 59.0% 65.1% 6.1%
Michigan 47.3% 50.6% 3.3%
Minnesota 46.4% 52.4% 6.0%
Mississippi 57.6% 40.1% -1.0%
Missouri 38.1% 41.4% 3.3%
Montana 35.7% 40.6% 4.9%
Nebraska 33.7% 39.2% 5.5%
Nevada 47.9% 50.1% 2.2%
New Hampshire 46.8% 52.7% 5.9%
New Jersey 55.5% 57.3% 1.8%
New Mexico 48.3% 54.3% 6.0%
New York 58.4% 60.4% 2.0%
North Carolina 46.2% 48.6% 2.4%
North Dakota 63.0% 27.2% 4.6%
Ohio 43.6% 45.2% 1.6%
Oklahoma 28.9% 32.3% 3.4%
Oregon 39.1% 50.1% 6.4%
Pennsylvania 47.8% 50.0% 2.2%
Rhode Island 54.4% 59.4% 5.0%
South Carolina 40.7% 43.4% 2.7%
South Dakota 31.7% 35.6% 3.9%
Tennessee 34.7% 37.5% 2.8%
Texas 43.2% 46.5% 3.3%
Utah 27.5% 37.7% 10.2%
Vermont 55.7% 65.5% 9.8%
Virginia 49.7% 54.1% 4.4%
Washington 52.5% 58.0% 5.5%
West Virginia 26.5% 29.7% 3.2%
Wisconsin 46.5% 49.4% 2.9%
Wyoming 21.6% 26.4% 4.8%

Performance Increase

STATE 2016 D 2020 D AVG GAIN
Utah 27.5% 37.7% 10.2%
Vermont 55.7% 65.5% 9.8%
Colorado 48.2% 55.4% 7.2%
Oregon 39.1% 50.1% 6.4%
Alaska 36.5% 42.8% 6.3%
Massachusetts 59.0% 65.1% 6.1%
Maine 46.4% 52.5% 6.1%
New Mexico 48.3% 54.3% 6.0%
Minnesota 46.4% 52.4% 6.0%
New Hampshire 46.8% 52.7% 5.9%
Idaho 27.5% 33.1% 5.6%
Kansas 36.0% 41.6% 5.6%
Delaware 53.1% 58.7% 5.6%
Nebraska 33.7% 39.2% 5.5%
Washington 52.5% 58.0% 5.5%
Maryland 60.3% 65.4% 5.1%
Rhode Island 54.4% 59.4% 5.0%
Montana 35.7% 40.6% 4.9%
Wyoming 21.6% 26.4% 4.8%
North Dakota 63.0% 27.2% 4.6%
Connecticut 54.6% 59.2% 4.6%
Virginia 49.7% 54.1% 4.4%
Arizona 45.1% 49.4% 4.3%
Georgia 45.6% 49.5% 3.9%
South Dakota 31.7% 35.6% 3.9%
Oklahoma 28.9% 32.3% 3.4%
Kentucky 32.7% 36.1% 3.4%
Michigan 47.3% 50.6% 3.3%
Texas 43.2% 46.5% 3.3%
Missouri 38.1% 41.4% 3.3%
Indiana 37.8% 41.0% 3.2%
West Virginia 26.5% 29.7% 3.2%
Iowa 41.7% 44.7% 3.0%
Wisconsin 46.5% 49.4% 2.9%
Tennessee 34.7% 37.5% 2.8%
South Carolina 40.7% 43.4% 2.7%
North Carolina 46.2% 48.6% 2.4%
Alabama 34.4% 36.6% 2.2%
Nevada 47.9% 50.1% 2.2%
Pennsylvania 47.8% 50.0% 2.2%
Hawaii 61.0% 63.1% 2.1%
New York 58.4% 60.4% 2.0%
California 61.7% 63.5% 1.8%
New Jersey 55.5% 57.3% 1.8%
Illinois 55.8% 57.5% 1.7%
Ohio 43.6% 45.2% 1.6%
Louisiana 38.4% 39.8% 1.4%
Arkansas 33.6% 34.8% 1.2%
Florida 47.8% 47.9% 0.1%
Mississippi 57.6% 40.1% -1.0%