Tag Archives: President Trump

The Scenario: There’s an Electoral College Tie in the Presidential
Election; What Happens Next?

By Jim Ellis

Sept. 23, 2020 — As we move closer to Election Day, various scenarios are being discussed and theorized about who will win the presidential race and which states will fall to what candidate. A little-mentioned outcome, which is a mathematical possibility, is an Electoral College tie.

A deadlock would occur if each candidate received 269 electoral votes. Based upon the 2016 result, which saw President Trump receiving 306 electoral votes to Hillary Clinton’s 232, a tie would occur if the incumbent were to lose exactly 37 electoral votes from his previous performance.

The easiest way for that to occur is if President Trump and former vice president Joe Biden were to build the same coalition of states with the exception of Pennsylvania, Michigan and the 2nd District of Nebraska going from the Republican to Democratic column. In this instance, the two 2020 candidates, Trump and Biden, would have 269 electoral votes apiece.

If this were to happen, how is a tie in the Electoral College resolved? The answer: in the House of Representatives. The difference between the vote for president and a regular House vote is that individual members do not have his or her own vote for president. Rather, each state delegation has one vote.

Therefore, California, for example, with its 53 House members gets one vote for president. Conversely, the at-large states with one House member, such as Alaska, Delaware, Montana, North Dakota, South Dakota, Vermont, and Wyoming, would also each get one vote. So the vote for president skews toward the small states and rural regions.

Interestingly though, the Democrats control the House majority with 232 members and one Democratic vacancy to 198 Republican seats with one Libertarian sitting in what is typically a Republican seat and three GOP vacancies. Yet, if partisanship holds, the Republicans would win a presidential election vote 26 to 23 with one state, Pennsylvania, in a 9-9 split delegation. Assuming that the Keystone delegation would fail to agree on a candidate, the state would not be able to cast its vote.

Continue reading

SCOTUS: The Effect of Replacing Late Supreme Court Justice Ruth Bader Ginsburg On The 35 Senate Races

By Jim Ellis

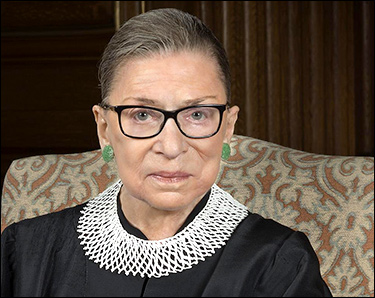
Late Supreme Court Justice Ruth Bader Ginsburg

Sept. 22, 2020 — A secondary question surrounding the replacement process for the late Supreme Court Justice Ruth Bader Ginsburg is how will the confirmation fight over the next judicial nominee resonate in the 35 Senate races?

In the 18 campaigns that appear non-competitive (9D; 8R) – for example, in Illinois (Sen. Dick Durbin-D), Rhode Island (Sen. Jack Reed-D), Arkansas (Sen. Tom Cotton-R), and Idaho (Sen. Jim Risch-R) to name a representative quartet – the Supreme Court battle will have little influence over the Senate outcome since those situations are virtually decided.

If the individual campaigns play the issue correctly, however, the Supreme Court vacancy development could be a boon to most competitive Republican incumbents and candidates in traditionally conservative states that are moving closer to the political center.

Democratic challengers in the more conservative states could have trouble because the issue matrix likely to be discussed through the nomination and confirmation process should activate the more conservative voting base. This is likely the case in the key competitive southern domains (AL, GA, NC), and in the Midwest and Rocky Mountain states, particularly in Iowa, the Kansas open seat, and for the Montana duel, in addition to the far west campaign in Alaska.

Perhaps the senator in the worst confirmation question situation, and one who can ill afford to be embroiled in such a predicament, is Maine Sen. Susan Collins (R). Already trailing in polling to state House Speaker Sara Gideon, Sen. Collins’ immediate call to postpone the process, and what will likely lead to a vote against the motion to proceed, will likely cost her conservative votes that she badly needs.

Her position to postpone has likely angered many who comprise the conservative base and gained her nothing with the Independents and soft Democrats that she desperately needs to close the gap between she and Gideon.

Continue reading

Sen. Lindsey Graham’s Challenge

By Jim Ellis

Is incumbent Sen. Lindsey Graham (R-SC) in re-election trouble?

Sept. 18, 2020 — Quinnipiac University surveyed the South Carolina political situation as part of their three-state polling series, which again produces some eyebrow-raising data. The results help identify why Sen. Lindsey Graham, a Republican senator from a Republican state, finds himself languishing in a competitive contest.

The poll (Sept. 10-14; 969 likely South Carolina voters, live interview conducted by the RDD firm for Quinnipiac) tested both the presidential and Senate campaigns. President Trump leads former vice president Joe Biden 51-45 percent in a ballot test that seems to be an under-count when looking at the survey’s supporting numbers. Sen. Graham, however, falls into a tie with opponent Jaime Harrison, at 48-48 percent, in a result that the underlying responses do seem to support.

President Trump’s six-point lead appears low because he tops Biden on virtually every personal and issue question. The Trump favorability index is 51:45 percent positive to negative, but the Biden ratio is much worse at 43:50 percent. The generic Republican-Democrat number falls 52-44 percent in favor of the GOP label.

Despite poor coronavirus management numbers for the president nationally, this South Carolina survey returns a 49:48 percent approval number on his handling of the issue. Furthermore, the respondents, in a 50-46 percent break, believe President Trump would do a better job handling coronavirus in the future than Biden. Not a particularly strong performance in this issue area, but better for the President than in almost any other place.

Trump also scores better in his handling of the economy (55-40 percent), the military (54-42 percent), and “keeping your family safe” (52-43 percent). Biden is favored, and only barely, 48-46 percent, on just one issue: racial equality.

Most importantly, the issue matrix sets up perfectly for Trump. The top two issues, according to these respondents, are the ones upon which the president is basing his campaign, law and order (23 percent) and bringing back the economy (22 percent). The Biden key issues rate rather poorly: coronavirus (12 percent), racial equality (12 percent), and healthcare (10 percent).

All of these underlying numbers suggest the Trump ballot test margin should be stronger than six points, which could be a signal that there is a “shy Trump voter factor” even in what is typically a safe Republican state. The “shy Trump voter” is the phrase now used to describe the individual who only secretly favors the president.

Continue reading

Reading North Carolina

By Jim Ellis

Sept. 17, 2020 — CNN released new North Carolina poll results earlier this week, and we again see a familiar pattern unfolding. There has been a Republican under-poll in the southern states detected in the past few elections, and the North Carolina pattern appears to form relatively consistently upon studying its most competitive statewide races in 2014, ’16, and what may be happening in 2020. There were no statewide Tar Heel State contests in 2018.

The CNN poll (conducted through the SSRS statistical firm; Sept. 9-13; 787 likely North Carolina voters; live interview through landline and mobile phones) found former vice president Joe Biden leading President Trump, 49-46 percent; Democratic US Senate nominee Cal Cunningham edging incumbent Republican Thom Tillis, 47-46 percent; and Gov. Roy Cooper (D) easily outdistancing Republican Lt. Gov. Dan Forest, 53-44 percent.

How do these mid-September races compare with other campaigns at this same interval, and what does that tell us for autumn?

First, the CNN poll is one of seven polls conducted in North Carolina during the month of September, and its three-point margin for Biden is the Democrat’s second-best showing within this group. The only better Biden performance came from the Fox News poll at the beginning of September (Aug. 29-Sept. 1; 722 likely North Carolina voters, live interview), which posted him to a four-point, 50-46 percent, advantage.

Among the five other surveys, Biden is ahead in two, President Trump in two, and one has the pair tied at 47 percent apiece (Survey USA for WRAL-TV; Sept. 10-13; 596 likely North Carolina voters). From the eight polls conducted from Aug. 29-Sept. 13, Biden’s edge is just 0.7 percent, meaning the two candidates average to a statistical tie.

Recent political history suggests that this type of an average spread sets up well for President Trump, and possibly Sen. Tillis. It appears that Gov. Cooper’s margin is beyond the statistically relevant late-term Republican swing.

In September of 2016, a total of 14 publicly released polls were conducted during that month. Within this group, Hillary Clinton led in 10 of the surveys with an average spread of 2.4 percentage points. Trump was ahead in just three polls with an average margin of 2.0 percent. Two polls found the candidates tied. Therefore, Clinton’s overall September edge was an average 1.1 percent.

Continue reading

Why Arizona is So Pivotal

By Jim Ellis

Does Arizona hold the key in a Trump-Biden election?

Sept. 16, 2020 — For several reasons, the Grand Canyon State of Arizona is possibly the most important state on the political map to determine the ultimate presidential election outcome.

Primarily, Arizona is one of five core states that President Trump must win to form a foundation for a favorable remaining state coalition map. The other four, geographically from west to east, are Texas, Georgia, Florida, and North Carolina. Should Joe Biden break through in any one of these five states, he will likely win the national election.

At this point, Arizona appears to be the most precarious of the Trump core states. While the President’s numbers are improving here, the September polls find him trailing Biden in all six publicly released surveys from a range of one to nine points among likely voters, with a mean average of Biden plus-4, and a median of Biden plus-3.5.

The five states are so critical to President Trump, or any Republican national candidate, because, as a unit, they yield a relatively easy remaining victory map. Carrying the five southern sector domains and assuming no leakage in Ohio or Iowa, and even while not winning Nevada or New Hampshire, the GOP nominee then claims the presidency with a victory in any one of the key Great Lakes states: Michigan, Minnesota, Pennsylvania, or Wisconsin. For a Democrat to win under this scenario, he or she would be forced to sweep the aforementioned quartet.

President Trump won the 2016 Electoral College vote 306-232, which means he can relinquish a net 36 electoral votes in 2020 and still win the national election. Under the scenario of him taking either Wisconsin or Minnesota, along with keeping Arizona, he would defeat Biden with exactly 270 electoral votes. This model also assumes he wins the 2nd Congressional District from both Nebraska and Maine, the two states that split their electoral votes. He won both in 2016. Under this scenario, Michigan and Pennsylvania would go to Biden.

Arizona, now potentially teetering toward the Democrats, is critical to the president’s prospects because Trump cannot afford to trade it for one of the western Great Lakes States, either Minnesota or Wisconsin. Such a loss would force the president to win two of the four Great Lakes, but only one could be Minnesota or Wisconsin since those two states have 10 electoral votes and Arizona has 11.

Therefore, simply put, losing Arizona because of its 11th electoral vote would mean that Trump would be forced to carry either Michigan or Pennsylvania in addition to one of the other three remaining Great Lakes States. A further scenario involving Trump losing Arizona and replacing it with both of the 10-electoral vote states (MN and WI) could result in the election ending in a 269-269 tie. This would force a tiebreaker to be decided in the US House of Representatives.

Let’s look at the chances of Trump winning Arizona by comparing his current standing to where he was at this point in 2016. Looking at the Real Clear Politics polling archives, we find that 19 Arizona polls were conducted during the entire 2016 election cycle. In 2020, just since the July 4th holiday break, 25 surveys were publicly reported in the Grand Canyon State.

Four years ago, at the end of August through mid-September, two individual polls came from Gravis Marketing (Aug. 25-27, 2016) and NBC News/Marist College (Sept. 6-8, 2016). These surveys yielded Trump four and one-point leads, respectively. Shortly thereafter, the trend began to turn Hillary Clinton’s way. The OH Predictive Insights survey (Sept. 28-30, 2016) found the two candidates tied at 42 percent apiece, while Emerson College (Oct. 2-4, 2016) and the Arizona Republic newspaper poll (Oct. 10-15, 2016) detected consecutive leads for Clinton of two and five points.

Therefore, Arizona did not turn toward Trump for good until the Monmouth University survey in late October (Oct. 21-24, 2016), which put him just one point ahead. Going into the election from that point, and remembering the 2016 election was on Nov. 8, Trump led in the final four polls from a two to five-point margin. He would eventually win the actual vote count by 3.6 percentage points, 48.7 – 45.1 percent, meaning a raw vote margin of 91,234 votes of more than 2.573 million ballots cast.

Because of Arizona’s fast population growth, the state has changed in four years. During that interval, the overall population expanded five percentage points to 7,278,717 individuals according to the Census Bureau’s July 2019 estimate, the latest available.

Minorities, specifically Hispanics and blacks, account for approximately 69 percent of the population gain, thus at least partially explaining Biden’s improved prospects in the state. Overall, Hispanics represent 31.7 percent of the overall Arizona population, and blacks 5.2 percent, as compared to the non-Hispanic white position receding to 54.1 percent.

The population changes suggest that this already tight political state will likely become even closer as we head for Nov. 3.

A Polling Comparison

By Jim Ellis

Neck-and-neck polling in a few key battleground states between President Donald Trump and former vice president Joe Biden shows interesting parallels to the 2016 race between Trump and Hillary Clinton.

Sept. 10, 2020 — With a plethora of presidential polls being released every week providing sometimes radically diverse results, it is often difficult to draw a clear picture of where the electorate is heading.

The conventional wisdom and preponderance of polling trends suggest that Joe Biden is leading the presidential race, but that President Trump is making a comeback, and the race is beginning to show some of the same characteristics found in 2016.

Three of the key states that baffled the political pollsters four years ago were Michigan, Pennsylvania, and Wisconsin. As we will remember, President Trump was expected to lose them all but scored close upset victories in each place.

The aggregate group of 2016 pollsters missed in each of the three states and the Real Clear Politics polling archives still publicly maintains all of those survey results. Therefore, we have the historical data to draw clear parallels between then and now.

In Wisconsin, 33 polls were taken during the election cycle and only one, from the Trafalgar Group at the end of the campaign season, placed Trump in front. A total of 62 polls were conducted in Pennsylvania with only three, again including a Trafalgar poll, projecting the future president into the lead. In Michigan, 42 polls were publicly released with Trump ahead in just two.

Though it is not generally statistically significant to average polling results because the polling methodologies, and certainly sample sizes, are very different, doing so does give us a guide as to the error factor that was present in 2016, and possibly a glimpse into what might exist this year.

In Wisconsin, the average Hillary Clinton lead advancing into the general election was 6.5 percentage points. With a 0.7 percent win for Trump, the overall error factor became a whopping 7.2 percent. The Pennsylvania numbers were closer but still a significant miss. Clinton’s average lead heading into Election Day was 2.1 percent and the president won there by the same 0.7 percent that he carried Wisconsin. Therefore, the Keystone State error factor was 2.8. Michigan was a similar story. Error factor: Clinton plus-3.6 percent. Trump victory margin: just 0.3. Total Michigan error factor: 3.9.

Continue reading

New Hampshire Results

By Jim Ellis

Sept. 9, 2020 — The New Hampshire nomination vote was held yesterday, ironically very late in an election cycle in which this state was the first to host a presidential primary. The results unfolded as generally predicted.

Sen. Jeanne Shaheen stands for a third term and was easily re-nominated with 94 percent of the vote against a weak Democratic opposition field. On the Republican side, businessman Bryant “Corky” Messner, who has already loaned his campaign approximately $4 million, defeated retired Army general Don Bolduc with a 51-42 percent victory margin. Sen. Shaheen is a clear favorite for the general election, but upsets are a frequent occurrence in New Hampshire politics, so no victory can be taken for granted.

A close election here is possible again. In Sen. Shaheen’s two federal election victories, her win percentages were only 51.6 and 51.5 percent in 2008 and 2014, respectively. Additionally, in the 2002 campaign, as the sitting governor, she lost to then-US Rep. John E. Sununu (R), 51-46 percent. Returning for the 2008 race she unseated her former opponent, and then six years later defeated former Massachusetts US Sen. Scott Brown (R) who launched a new Senate bid from his neighboring state.

The last election for the state’s other Senate seat was also very close. In 2016, then-Gov. Maggie Hassan (D) unseated Sen. Kelly Ayotte, 48.0 – 47.8 percent, a margin of just 1,017 votes from more than 739,000 ballots cast.

Gov. Chris Sununu (R) is running for a third two-year term – New Hampshire and neighboring Vermont are the only two states that mandate two-year gubernatorial terms – and was easily re-nominated with 90 percent of the Republican primary vote. The Democrats, however, featured a more competitive contest, with state Senate Majority Leader Dan Feltes (D-Concord) apparently topping Executive Councilor Andru Volinsky, 51-49 percent, but with several precincts still outstanding. It is likely the Feltes margin will hold, though it is still mathematically possible for the final outcome to switch.

Turnout in the state was interesting because of its inconsistency between the two statewide offices, which is unusual. In the governor’s race, more Republicans than Democrats voted, so far 129,404 to 124,697 with further ballots to count. The Senate campaign, however, featuring a Democratic incumbent, saw a reversal of the turnout model. In that race, more Democrats have voted so far, 133,729 to 122,676.

Continue reading