Tag Archives: battleground states

Key States: President By CD

Daily Kos Elections – presidential results by congressional district. Click on image to see full interactive map at Daily Kos.

By Jim Ellis

Dec. 14, 2020 — The Daily Kos Elections organization is rapidly going through the election returns to provide a presidential vote depiction for every congressional district. At this point, they are only about a quarter of the way through the country but have already recorded some critical battleground states such as Iowa, Michigan, Nevada, Ohio, and Wisconsin.

Dividing the national presidential vote into individual congressional districts portends better analysis because patterns are easier to decipher and analyze in smaller geographic segments.

In the aforementioned five-state region, 46 congressional districts are housed. Turning to the November election, Republicans won 28 of the US House seats in these states while Democrats recorded 18 victories. Just two of the CDs, both in Iowa, switched parties, and went from Democrat to Republican.

In these decisive states, several interesting patterns became evident. What appears clear, in most instances, is President Trump improving upon his 2016 vote percentages and former vice president Joe Biden surpassing Hillary Clinton’s totals of four years ago in all but four of the 46 congressional districts.

Trump exceeded his 2016 percentage performance in 35 of the 46 districts and failed to do so in 11. This despite the fact that he would lose three of the five states studied in this exercise.

Perhaps the most indicative finding centers around President Trump’s standing when compared with the various Republican congressional candidates in all of the tested districts. The fact that he finished under the GOP congressional candidate’s percentage in 32 of the 46 CDs is significant and the key to understanding why he lost two of the states that he carried in 2016. The totals suggest that Republican elasticity in these 32 districts was greater than what the President achieved.

Such is particularly true in the state of Wisconsin, a place Trump lost this year by just over 20,000 votes of almost 3.3 million ballots cast, or only half a percentage point. When examining the eight Wisconsin federal districts, we see Trump running behind the Republican congressional candidate in all five of the GOP-held districts and in two of three Democratic seats.

Continue reading

The Final Polls

By Jim Ellis

Nov. 2, 2020 — Tomorrow is the official Election Day, but with early voting delivering nearly 87 million votes and 21 states allowing ballots to come in after Nov. 3, it is likely that many Senate and House races will languish in political overtime. With that background, we look at the polling range of the most recent surveys in battleground Senate races along with the number of people who have already cast their ballots in each state (early voting statistics from TargetSmart.com):


ALABAMA:
• Sen. Doug Jones (D) vs. Tommy Tuberville (R)
Polling Range
High: Cygnal (Oct. 26-28) – Tuberville +14
Low: Auburn U Montgomery (Oct. 23-28) – Tuberville +11
No Early Voting


ALASKA:
• Sen. Dan Sullivan (R) vs. Dr. Al Gross (I/D)
Polling Range
High: Gravis Marketing (Oct. 21-23) – Sullivan +3
Low: Change Research (Oct. 16-19) – Sullivan +3

Early Voting Stats:
Republican: 49.1% Total Early Voting 2020: 131,261
Democrat: 33.0% Total Early Voting 2016: 64,583
Unaffiliated: 17.9% Percent Increase: 103%

ARIZONA:
• Sen. Martha McSally (R) vs. Mark Kelly (D)
Polling Range
High: Siena College/NYT (Oct. 26-30) – Kelly +7
Low: Emerson College (Oct. 29-31) – Kelly +3

Early Voting Stats:
Republican: 47.0% Total Early Voting 2020: 2,376,706
Democrat: 46.4% Total Early Voting 2016: 1,658,410
Unaffiliated: 6.6% Percent Increase: 43%

COLORADO:
Sen. Cory Gardner (R) vs. Ex-Gov. John Hickenlooper (D)
Polling Range
High: RMG Research (Oct. 9-15) – Hickenlooper +9
Low: Morning Consult (Oct. 11-20) – Hickenlooper +8

Early Voting Stats:
Democrat: 47.0% Total Early Voting 2020: 2,376,706
Republican: 42.7% Total Early Voting 2016: 1,658,410
Unaffiliated: 9.6% Percent Increase: 39%

GEORGIA-A:
• Sen. David Perdue (R) vs. Jon Ossoff (D)
Polling Range
High: Public Policy Polling (Oct. 27-28) – Ossoff +3
Low: Landmark Communications (Oct. 28) – Even


GEORGIA-B: Jungle Primary
• (Sen. Kelly Loeffler (R) vs. Rev. Raphael Warnock (D) and Rep. Doug Collins (R)
High: Public Policy Polling (Oct. 27-28) – Warnock +19
                                                             – Loeffler + 8
                                                               (over Collins)
Low: Emerson College (Oct. 29-31) – Warnock +11
                                                        – Collins +3
                                                          (over Loeffler)

Early Voting Stats:
Republican: 49.8% Total Early Voting 2020: 3,812,140
Democrat: 42.9% Total Early Voting 2016: 2,385,990
Unaffiliated: 7.3% Percent Increase: 60%

Continue reading

A Polling Comparison

By Jim Ellis

Neck-and-neck polling in a few key battleground states between President Donald Trump and former vice president Joe Biden shows interesting parallels to the 2016 race between Trump and Hillary Clinton.

Sept. 10, 2020 — With a plethora of presidential polls being released every week providing sometimes radically diverse results, it is often difficult to draw a clear picture of where the electorate is heading.

The conventional wisdom and preponderance of polling trends suggest that Joe Biden is leading the presidential race, but that President Trump is making a comeback, and the race is beginning to show some of the same characteristics found in 2016.

Three of the key states that baffled the political pollsters four years ago were Michigan, Pennsylvania, and Wisconsin. As we will remember, President Trump was expected to lose them all but scored close upset victories in each place.

The aggregate group of 2016 pollsters missed in each of the three states and the Real Clear Politics polling archives still publicly maintains all of those survey results. Therefore, we have the historical data to draw clear parallels between then and now.

In Wisconsin, 33 polls were taken during the election cycle and only one, from the Trafalgar Group at the end of the campaign season, placed Trump in front. A total of 62 polls were conducted in Pennsylvania with only three, again including a Trafalgar poll, projecting the future president into the lead. In Michigan, 42 polls were publicly released with Trump ahead in just two.

Though it is not generally statistically significant to average polling results because the polling methodologies, and certainly sample sizes, are very different, doing so does give us a guide as to the error factor that was present in 2016, and possibly a glimpse into what might exist this year.

In Wisconsin, the average Hillary Clinton lead advancing into the general election was 6.5 percentage points. With a 0.7 percent win for Trump, the overall error factor became a whopping 7.2 percent. The Pennsylvania numbers were closer but still a significant miss. Clinton’s average lead heading into Election Day was 2.1 percent and the president won there by the same 0.7 percent that he carried Wisconsin. Therefore, the Keystone State error factor was 2.8. Michigan was a similar story. Error factor: Clinton plus-3.6 percent. Trump victory margin: just 0.3. Total Michigan error factor: 3.9.

Continue reading

Is Biden Under-Performing?

By Jim Ellis

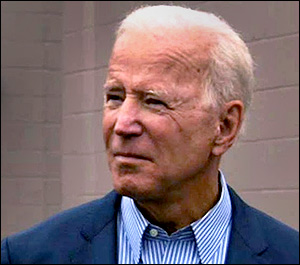
Former vice president and current 2020 presidential candidate, Joe Biden (D)

May 28, 2020 — Currently, former vice president Joe Biden is leading in virtually every battleground state poll that has been released into the public domain; but do the survey numbers tell the whole story? Other available data, that derived from actual votes being cast, suggest there may be cracks forming in his political armor.

In terms of battleground states, a new Arizona poll was released Tuesday, in what could become the most important must-win domain for the Trump campaign. There, the Phoenix-based HighGround Public Affairs consulting firm publicized their latest Arizona statewide poll (May 18-22; 400 likely Arizona general election voters), and the ballot test projects Biden holding a tighter 47.0 – 45.3 percent edge over President Trump.

Though Biden leads, the trend is a clear improvement for Trump since the OH Predictive Insights poll (May 9-11; 600 likely Arizona voters) became public during mid-May and posted the former vice president to a 50-43 percent advantage. Redfield & Wilton Strategies followed with their survey release (May 10-14; 946 likely Arizona voters) that yielded a closer 45-41 percent Biden lead.

Tuesday’s HighGround survey also published some interesting secondary questions. In answering whether the respondents felt President Trump job performance was excellent, very good, or OK, the combined positive calculated to 49.5 percent. Among those believing the president’s job performance is poor or failing, the negative totaled to 49.0 percent.

Accordingly, 29.3 percent of the Arizona respondent sample believes President Trump is to blame for the spread of the coronavirus, while 20.3 percent pin the responsibility on China. All other responses: the people, federal government, Democrats, or other unnamed sources each registered less than 10 percentage points. A total of 25.3 percent say they either don’t know or believe no single source is to blame.

Over the Memorial Day weekend, the state of Hawaii hosted its Democratic presidential primary. The unique format is interesting in that there were two votes the participants cast: the first included choosing among all of the names who originally qualified for the Hawaii presidential nomination ballot. The second isolated only Biden and Sen. Bernie Sanders (I-VT). Just under 35,000 people cast mail votes in the stand-alone presidential primary.

Continue reading