By Jim Ellis — Tuesday, Nov. 8, 2020
 With Election Day upon us, we have come to the end of the 2022 cycle; while strategists from both parties are either confidently or reluctantly predicting a Republican victory, not all of the numbers suggest a Red Wave outcome.
Polling generally suggests a good trend for Republicans, but the margin spread is certainly not overwhelming, and under what should be present if this were to become a wave election.
The Biden favorability index is an upside-down 44:53 percent favorable to unfavorable, which is commensurate with Donald Trump’s numbers prior to the 2018 midterm election.
Overall, it does appear that Republicans are well positioned to claim the House majority. The professional and media pollster range is wide and runs from a Republican +14 to +48 seats, but even the low-end prediction would deliver the majority. It is reasonable to believe that the Republican gain factor will be under 30, but this lower number range would still project a comfortable House majority in the new Congress.
The Senate is a flat toss-up with so many races, Arizona, Georgia, Nevada, New Hampshire, Ohio, Pennsylvania, and Wisconsin all polling within a small single-digit margin. Therefore, predicting the eventual outcome has a high difficulty factor. One point that is predictable, though: count on many of these races going into political overtime. This means it could take days if not more than a week to report a final tally on an inordinate number of close races.
With that said, let’s look at the competitive/volatile/interesting races to watch this Election Day:
Senate
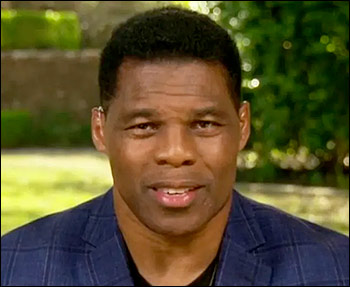
Georgia — The Peach State features one of the top US Senate races, and one of only four Republican major conversion targets. Sen. Raphael Warnock (D), who won the special election runoff in 2021, is now running for a full six-year term. His opponent is former University of Georgia and professional football star Herschel Walker (R), and the two will continue to battle until the last vote is counted. Georgia has a majority vote rule, so if neither Sen. Warnock nor Walker reaches 50 percent, the two will advance to a post-election runoff on Dec. 6.
Ohio — The Senate race dominates the Buckeye State political landscape as US Rep. Tim Ryan (D-Warren/Youngstown) and author J.D. Vance (R) battle to the last day of this election cycle. Vance has led in most polls, 15 of the last 19 with two ties, but the Democrats appear to be performing slightly better in early voting. Vance has to be rated at least a soft favorite to win today. Ohio is a must-win for the GOP.
Helping Vance is a strong Gov. Mike DeWine (R) at the top of the ticket who is poised to win a landslide victory. Keeping the DeWine coalition consistent for Vance will be a boost that could well propel him to the victory.
Pennsylvania — Possibly the most publicized Senate race in the country, the open contest between Democratic Lt. Gov. John Fetterman and television’s Dr. Mehmet Oz (R), could well decide the Senate majority. Many believe that the party carrying Pennsylvania punches their majority ticket. Dr. Oz now leads in most polls after the two met in a highly publicized debate on Oct. 25. Early voting patterns, however, appear to favor the Democrats. Remembering that the Republican primary took about a month to decide because the result was so close, it wouldn’t be surprising to see something similar occur for the general election.
Arizona — The Grand Canyon State is one of the hottest political domains in the country. A now toss-up Senate race featuring Sen. Mark Kelly (D) and venture capitalist Blake Masters (R) suggests that this contest will end with a very tight result. Sen. Kelly has a slight lead in polling, but Republicans have the edge in early voting. The governor’s race is also close, but late polls suggest that Republican Kari Lake has late momentum in her race opposite Democratic Secretary of State Katie Hobbs.
Utah — The US Senate race is dominating the Utah political talk as Sen. Mike Lee (R) is on the ballot for a third term, but this time he faces a strong Independent opponent in former presidential candidate (2016) Evan McMullin. Democrats decided not to file their own candidate so they could coalesce behind McMullin and give Sen. Lee a serious challenge. The strategy has worked, as polling shows this race falling into the single-digits. Chances are still good that Sen. Lee pulls away, but this contest has evolved into much more of a serious battle than once believed. Look for a close result.
Nevada — Tough races from the top of the ballot to the bottom face Silver State voters, and the Senate race may yield the Republicans their top conversion opportunity. Polling between former Attorney General Adam Laxalt (R) and Sen. Catherine Cortez Masto (D) has been nip and tuck. With an improved standing among Hispanics, who now are 31 percent of the state’s population, an upset here is possible. Additionally, Democratic Gov. Steve Sisolak is in a toss-up race with Clark County Sheriff Joe Lombardo (R), and this seat could flip, too. Also, in the House races, the new redistricting plan drew three lean Democratic seats in Las Vegas. To gain the majority, Republicans will need to score at least one win here.
Washington — Republicans recruited a strong candidate in former nurse and veterans’ activist Tiffany Smiley. She has become a very good fundraiser and has polled close to veteran Sen. Patty Murray (D). Though Smiley has put forth a strong effort, it will likely not be enough in a strongly Democratic state like Washington. Though she may do well, a close loss is likely on the political horizon for Smiley as opposed to losing big.
Iowa — Sen. Chuck Grassley (R) leads a very busy Iowa ballot. The senator, seeking an eighth term at the age of 89, is in a closer battle than he usually finds, this time against retired Navy Adm. Michael Franken (D). Late polling suggests that Sen. Grassley will still win a comfortable, but not overwhelming victory, meaning he is likely to win in the 50s instead of his customary 60s. Conversely, Gov. Kim Reynolds (R) looks to be cruising to re-election and is expected to easily win a second full term.
North Carolina — The Senate race tops the Tar Heel State ballot this year, and we see another typically tight North Carolina race concluding. US Rep. Ted Budd (R-Advance) looks to have a slight edge over former state Supreme Court Chief Justice Cheri Beasley (D). Early voting is about even between the two parties in terms of past performance, so this is another race that comes down to the wire.
New Hampshire — In what is arguably the most prevalent swing state in the country, the Granite State ballot is filled with competitive races. Gov. Chris Sununu (R) looks set to win a fourth two-year term, but the state’s US Senate race is one of the country’s hottest. Though retired Gen. Don Bolduc (R) was virtually left for politically dead after winning the Sept. 13 primary by a percentage point, he has battled back into competitive status against one-term incumbent and former governor, Sen. Maggie Hassan (D). This race is now in upset alert status.
House
Alaska — The Last Frontier was the host of an interesting special at-large US House election that saw the new Ranked Choice Voting (RCV) system produce state Rep. Mary Peltola (D-Bethel) as the replacement for the late Rep. Don Young (R), even though Republican candidates received an aggregate 60 percent of the vote.
Now, however, it appears Rep. Peltola will win a full term regardless of whether she faces former Gov. Sarah Palin or businessman Nick Begich III, whose late grandfather and uncle served in the House and Senate, respectively, as Democrats. It is further possible that Peltola will win without even being forced into an RCV round because she may garner majority support on the initial vote.
Conversely, Sen. Lisa Murkowski could be forced into a RCV runoff with former State Administration Director Kelly Tshibaka in what would be a double-Republican race. This is a competitive contest, though the Republicans will retain the seat regardless of the outcome.
Iowa — In the state’s four congressional districts, three are highly competitive. In new District 1, freshman Rep. Ashley Hinson (R-Marion/Cedar Rapids) is favored for a second term against state Sen. Liz Mathis (D-Hiawatha). Rep. Mariannette Miller-Meeks (R-Ottumwa), who was a six-vote winner in 2020, looks to be favored over state Rep. Christina Bohannan (D-Iowa City) by more than her previous victory margin, but this contest will still be close in a historically competitive southeastern Iowa district.
The 3rd District battle may be the most competitive within this trio of races. Rep. Cindy Axne (D-Des Moines) is running for a third term having never achieved majority support. State Sen. Zach Nunn (R-Bondurant) is one of the Republicans’ better challenge candidates, and certainly has a strong chance of unseating the congresswoman. This race will draw national attention on election night.
Ohio — In the House races, veteran Cincinnati Rep. Steve Chabot (R) has a much more difficult district (D+3 according to the FiveThirtyEight data organization) than his previous seat. Cincinnati City Councilman Greg Landsman (D) is the Democratic nominee. Rep. Chabot will need a strong turnout model to record another victory in his long 26-year congressional career.
Though veteran Rep. Marcy Kaptur (D-Toledo), the dean of the Democratic conference with 40 years of congressional service, fared poorly in redistricting as her seat went from D+16 to R+6, the Republicans nominating January 6th participant J.D. Majewski has helped paved the path for the congresswoman’s re-election.
The new 13th District, located southeast of Cleveland and anchored in Akron, features a tight contest between Republican attorney Madison Gesiotto Gilbert and Democratic state Rep. Emilia Sykes (D-Akron). In a seat rated R+2, this contest is anybody’s game.
Arizona — Four competitive seats are on tap in the House delegation. Rep. David Schweikert (R-Fountain Hills) face a tough first-time candidate in businessman Jevin Hodge (D) from a new 1st District that is much less Republican than his current 6th CD, a place in which his 2020 re-election percentage did not exceed 52.
Republican Eli Crane, in a new district that is heavily Republican, is favored to unseat Rep. Tom O’Halleran (D-Sedona). Restauranteur Kelly Cooper (R) is challenging Rep. Greg Stanton (D-Phoenix) in a new 4th CD that is now only slightly Democratic. While the congressman is favored, Cooper is a formidable challenger. Rep. Ann Kirkpatrick (D-Tucson) retiring leaves the new 6th CD as a toss-up battleground between former Hispanic Chamber of Commerce executive Juan Ciscomani (R) and ex-state Senator Kirsten Engel (D).
Oregon — Reapportionment delivered a new seat to Oregon, which was placed in the area between Salem and Portland. The primary saw Democratic Rep. Kurt Schrader (D-Canby) lose to newcomer Jamie McLeod-Skinner, who is a former local official in Santa Clara County, Calif. Polling suggests that businesswoman and former local mayor, Lori Chavez-DeRemer (R), has a chance to score an upset win. Competition is also strong in the new 6th District and in the adjacent seat from which veteran Rep. Peter DeFazio (D-Springfield) is retiring.
New Hampshire — The Granite State’s two congressional districts are also highly competitive. Two-term Rep. Chris Pappas’ (D-Manchester) 1st District has defeated more incumbents since 2004 than any seat in the country. Polling has generally posted him ahead of former Trump White House aide Karoline Leavitt (R), but nothing is ever certain in such a volatile political domain.
Rep. Annie Kuster’s (D-Hopkinton/Concord) western state 2nd District is more Democratic than the eastern 1st, but this seat too can record close elections. If what some predict is a coming red wave truly develops, both Democratic incumbents could be unseated.
Governor
Georgia — The governor’s race is also intense, which features a re-match between now-Gov. Brian Kemp (R) and former state House Minority Leader Stacey Abrams (D). Polling suggests that Gov. Kemp will win re-election with a larger vote than the small margin he garnered in 2018, which resulted in his claiming the governorship through a one-point plus win. Though polling is generally looking good for the Republicans here, Democrats are so far exceeding their 2020 early vote performance.
Florida — Florida voters are navigating through a very busy ballot that the governor’s race headlines. Incumbent Gov. Ron DeSantis (R) appears likely to earn a comfortable, low double-digit victory over former governor and resigned congressman, Charlie Crist (D). The late-cycle polling, early voting matrix, and turnout model looks to favor Republicans, which will allow Sen. Marco Rubio (R) to turn back a strong challenge from US Rep. Val Demings (D-Orlando).
Michigan — Inconsistent polling suggests at least a semi-competitive governor’s race featuring incumbent Gretchen Whitmer (D) and challenger Tudor Dixon (R), an online radio personality. Early voting reports are heavily Democratic, which could be an indication of an impending Whitmer victory.
Oregon — The Beaver State is one of the 2022 political hotbeds. With an open governor’s race where a strong independent might flip the race to the Republican nominee in a plurality finish, Oregon is certainly a state to watch from the Pacific zone. Sen. Ron Wyden (D) faces only perennial opposition as he is on the ballot for a fifth full term.
New York — This is a close race, and incumbent Gov. Kathy Hochul (D), who ascended to the office when then-Gov. Andrew Cuomo (D) was forced to resign, finds herself in a much more difficult campaign against GOP US Rep. Lee Zeldin (R-Shirley/East Long Island) than she originally anticipated. Polling is now showing that the governor’s race is a potential toss-up. Still, the overwhelming Democratic margin in New York City should be enough to deliver Hochul a close victory at the very least.
Texas — Polling suggests a relatively close race between Gov. Greg Abbott (R) and former congressman and 2020 presidential candidate Beto O’Rourke (D). Texas Republicans typically are under-counted in polling, so it is likely that Gov. Abbott will score a stronger victory than currently projected.
Wisconsin — The Badger State is a major political battleground as close races for Gov. Tony Evers (D) and Republican Sen. Ron Johnson, are nip and tuck. Both are considered toss-ups, though polling now slightly favors Sen. Johnson in his re-election contest.