By Jim Ellis
Feb. 6, 2020 — Sen. Elizabeth Warren (D-MA) yesterday announced that she was suspending her presidential campaign, which became an eventuality when she finished third in her home state primary last Tuesday. Her exit helps evolve the Democratic presidential contest into a two-way affair.
Can Sen. Bernie Sanders (I-VT) win a two-person race when starting behind in the delegate count?
With political endorsements regularly being announced for former vice president Joe Biden during the post-Super Tuesday period, and momentum clearly behind his reinvigorated campaign, Sen. Sanders appears to have his political back against the figurative wall.
Currently, the unofficial delegate standing according to The Green Papers statistical website, a group that fully extrapolates the count in conjunction with Democratic National Committee apportionment rules, projects Biden to hold 656 bound first-delegate votes as compared to Sanders’ 584, an obvious difference of 72, which is a much better position than the media is currently portraying.
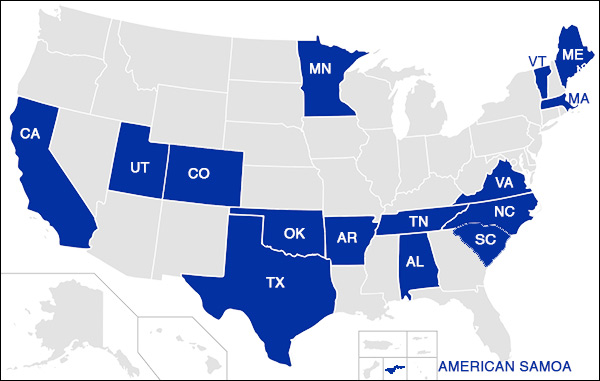
The March 10 primaries, which have not received much attention to date largely because most of the six states voting are relatively small, will become very important. Combined, the states possess a total of 352 bound first-ballot delegates led by Michigan’s 125 votes. The other states are Idaho (20 delegates), Mississippi (36), Missouri (68), North Dakota (14), and Washington (89).
From a national perspective, Sen. Sanders may well be in a position of having to score first-place finishes in four of these states. In the remaining two, Mississippi and Missouri, Biden has run strong in their region so there is little reason to believe that Sen. Sanders will be particularly competitive in either state.
The Vermont lawmaker has done well in traditionally Republican states among Democratic voters, so his chances in small Idaho and North Dakota should be strong.
 March 5, 2020 — Tuesday’s elections in Texas and California were subject to slow counting, but at least in the Lone Star State, the numbers are near final.
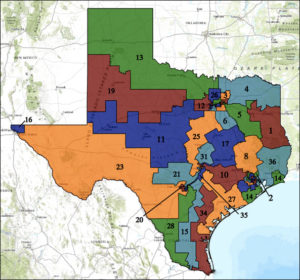


 Feb. 25, 2020 — While the Nevada Caucus counting drags on and tabulations will at some point determine just how many delegates Sen. Bernie Sanders (I-VT), former Vice President Joe Biden, and ex-Mayor Pete Buttigieg receive from the state – currently, it appears that Sanders will win somewhere between 19 and 23 bound delegate votes, while Biden and Buttigieg should both earn bound votes in the high single digits – a new US Senate poll is proving more curious today.