Tag Archives: Ohio

Tracking Trump’s Approval Ratings
Against Electoral College Results

2016 Electoral College Results map (270toWin)


By Jim Ellis

Feb. 26, 2019 — Already beginning to project where the states might fall in the 2020 presidential election, the Gallup organization released a 50-state survey tracking study Friday that summarizes their cumulative research collected throughout the past year.

Gallup finds President Trump slightly improving his standing over a similar project conducted from their aggregate 2017 data. Meanwhile, the Civiqs polling organization projects, as do all other pollsters, that Trump’s job approval remains upside-down. In the good news category for the president, however, the latter organization finds that he is viewed more positively than either of the national political parties.

Nationally, Trump carries a 44:52 percent job approval ratio according to the Civiqs poll of registered voters (polled continually from Oct. 12, 2015-Feb. 23, 2019; 181,729 responses during that multi-year tracking period). The Democratic Party, however, posts a lesser 39:52 percent rating, while the Republican Party lags behind both the president and their political party counterpart. The GOP registers a poor 26:60 percent index.

But these numbers are not particularly unusual because the same trend among the three polling subjects has been consistent for many months. The more telling conclusion is that the deviation factor among the approval ratings has remained constant for well over a year, suggesting that the electorate continues locked in a highly polarized and negative status.

Continue reading

Apportionment Projections:
Who is Gaining, Who is Losing

By Jim Ellis

Jan. 3, 2019 — Late last year, we covered the new Census Bureau report for the states gaining and losing population during the past 12-month period. Now, we see the agency’s latest just-released numbers for the decade through this past July. Armed with the new data, outside mathematicians have made apportionment projections to provide a more defined picture as to which states will be gaining or losing US House seats in the 2020 post-census reapportionment.

With two years remaining in the present decade, trends can still change and we must remember that the reapportionment formula is complex, but the new projections give us a strong idea as to just how many seats, give or take a small variance, will transfer. At this point, according to the Washington, DC-based Election Data Services, it appears that as many as 22 seats could change location affecting 17 states.

Texas, having gained 3.55 million people since the 2010 census, looks to be adding as many as three seats for the 2022 elections and beyond. This will give the Lone Star State 39 seats during the next decade, and 41 electoral votes in the succeeding presidential elections.

Florida was the second largest gainer with just under 2.5 million new residents, meaning the Sunshine State will likely gain two seats, going from 27 to 29. In terms of raw numbers, California gained more than 2.3 million people, but it actually dropped a tenth of a point below the national growth average of 6.3 percent for the past eight years. This means the Golden State is currently on the hook to actually lose a district for the first time in history.

Continue reading

Ohio: Contrasting Polls

By Jim Ellis

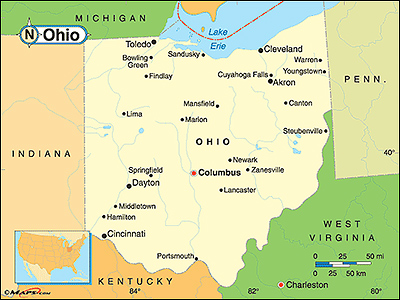
state-of-ohio-mapNov. 1, 2018 — The Buckeye State of Ohio is viewed as one of the country’s quintessential swing states. In 2016, however, the state exceeded polling and even Republican expectations in their presidential vote, as President Trump won a decisive 52-44 percent victory over Hillary Clinton.

Some suggested the Trump vote was an indication that the state could be moving more definitively to the political right, but new surveys suggest the Buckeye electorate is returning to its previous swing vote history.

Still, Ohio proves a reliable national political barometer. In both 2008 and 2012, the electorate here voted for President Obama after twice after backing President George W. Bush in his two elections. The state previously favored President Bill Clinton in his two successful national campaigns. In fact, the last time Ohioans failed to vote for the winning presidential candidate came in 1960 when the state awarded its electoral votes to Republican Richard Nixon in his national losing effort against John F. Kennedy.

Two new polls were released this week that paint different pictures of the Ohio electorate’s current state. Some of the results are curious to the point of questioning the polling reliability or not being able to adequately determine how the governor’s race will end and failing to understand the wide discrepancy in US Senate polling projections.

Continue reading

National Early Voting Report

By Jim Ellis

i-vote-i-countOct. 31, 2018 — Now more than halfway through the early voting period in the 37 states that offer early voting options for the populace, some places are turning in record participation rates. Each state has various nuances in their early voting procedures, so comparing the early reports to each other is of little value. Going back to contrast the current 2018 reported numbers with how that particular state voted in the last midterm election (2014) does have significance, however.

Already, in the latest available reports according to the United States Election Project administered by the personnel at the University of Florida, seven states are reporting more received early voting ballots than were recorded for the entire 2014 pre-election period. They are:

• Tennessee – 162.3% more ballots (1,029,846 versus 634,364 recorded in 2014)
• Texas – 144.3% increase (2,980,915 versus 2,066,368 recorded in 2014)
• Indiana – 127.9% increase (292,726 versus 228,932 recorded in 2014)
• Nevada – 122.5% increase (372,455 versus 304,005 recorded in 2014)
• Georgia – 111.1% increase (1,188,636 versus 1,069,912 recorded in 2014)
• Minnesota – 106.0% increase (249,909 versus 235,808 recorded in 2014)
• Delaware – 103.2% more ballots (8,550 versus 8,288 recorded in 2014)


An additional seven states have so far recorded better than 85 percent of their early voting total in comparison to their entire 2014 pre-election voting universe:

• North Carolina – 97.1% of previous (1,140,657 versus 1,174,188 recorded in 2014)
• Virginia – 94.2% of previous total (191,755 versus 203,556 recorded in 2014)
Continue reading

The Governors’ Races & Veto Power

By Jim Ellis

2018-elections-open-seats-185Oct. 29, 2018 — The 2018 election cycle features 36 gubernatorial campaigns, 26 of which have federal redistricting ramifications. The ones that don’t are at-large congressional district states (Alaska, South Dakota, Vermont, Wyoming) or will be after the next reapportionment (Rhode Island), those that employ redistricting commissions (Arizona, California, Hawaii, Idaho), or the multi-district state where the governor is only awarded a two-year term (New Hampshire).

Here is a breakdown of where things stand in the upcoming election in the 26 states where the governor will have redistricting veto power:


PURE TOSS UPS

FLORIDA: Mayor Andrew Gillum (D) vs. Ex-US Rep. Ron DeSantis (R)
• Most Recent Polls: Gravis Marketing (Oct. 22-23): Gillum 51 percent, DeSantis 46 percent
   Gray/Strategic Research (Oct. 16-23): DeSantis 48 percent; Gillum 45 percent

GEORGIA: Sec/State Brian Kemp (R) vs. Ex-state Rep. Stacey Abrams (D)
• Most Recent Poll: NBC News/Marist (Oct. 14-18): Kemp 49 percent; Abrams 47 percent

IOWA: Gov. Kim Reynolds (R) vs. Businessman Fred Hubbell (D)
• Most Recent Poll: Selzer & Co (Sept. 17-20): Hubbell 43 percent; Reynolds 41 percent

KANSAS: Sec of State Kris Kobach (R) vs. State Rep. Laura Kelly (D) & Greg Orman (I)
• Recent Poll: Public Policy Polling (Oct. 19-20): Kobach 41 percent; Kelly 41 percent; Orman 10 percent

NEVADA: Attorney Gen Adam Laxalt (R) vs. Commissioner Steve Sisolak (D)
• Most Recent Poll: Emerson College (Oct. 10-12): Laxalt 46 percent; Sisolak 41 percent

Continue reading

Forecasting the Results – Part II

By Jim Ellis

2018-democrat-house-majority-breakdown-text-graphicOct. 8, 2018 — The Democrats need to convert a net 24 seats to secure a one-seat majority in the US House on Election Day, Nov. 6. Many reports quote the number 23 as what is necessary to win control, but the new Pennsylvania map will yield one seat coming back to the Republicans — the new open 14th District — thus pushing the total up to 24.

As stated Friday, our forecasts listed below are based upon a series of factors, including current polling numbers, voter history, candidate personal and job approval favorability, fundraising, other races on the state ballot that could drive turnout, and outside issues such as the confirmation vote to for Judge Brett Kavanaugh to become a Supreme Court Justice, which could change the turnout model, etc.

According to our new analysis, the Democrats are on the cusp of converting the requisite number of Republican seats to take a bare majority and seeing their caucus become significantly larger. At this point, the Democratic gain range appears to reach 23 on the low side and 35 at the apex.

Looking at the country by state and region, it appears the Democrats will do well in the Midwest, in particular. The Great Lakes region that delivered President Trump his surprise victory appears to be snapping back to the Democrats in the midterm House races. Michigan looks particularly good for them at both the statewide and district levels.

Continue reading

Senate Recap – Part II

By Jim Ellis

US Senate makeup

US Senate makeup

Sept. 24, 2018 — Today we continue our look at the most competitive 17 US Senate contests with our second and final installment. To take a look at our Part I recap, please see our writeup this past Friday at: Senate Recap – Part I.


NEVADA

Sen. Dean Heller (R) is embroiled in an intense re-election battle with freshman Rep. Jacky Rosen (D-Henderson) as the two compete for a toss-up Senate seat. Heller won here in 2012 by a single percentage point over then-Rep. Shelley Berkley (D-Las Vegas), but that was in the election when President Obama carried Nevada, 52-46 percent.

Polls go back and forth between the senator and congresswoman, but neither leads beyond the margin of polling error. Since the beginning of September three polls have been released, and the average spread between the contenders is just two points. This is a pure toss-up election and, as a Republican defense seat, one of the most important campaigns in the nation.


NEW JERSEY

The Garden State is often a teaser for Republicans, meaning polls routinely suggest their candidates will fare better than actual results portend. The Senate race between incumbent Bob Menendez (D) and pharmaceutical CEO Bob Hugin (R) is likely no exception. Though several polls have indicated the race is competitive, it is probable that Sen. Menendez will pull away and score a comfortable win.

Polling has been scarce. The most recent survey was released in mid-August from Quinnipiac University (Aug. 15-20; 908 registered New Jersey voters) and projects the senator to be leading Hugin, 43-37 percent. Obviously, Menendez corruption trial that ended in the case against him falling apart and being dropped has taken a toll on his favorability index, but it is doubtful that even a 29:47 percent positive to negative personal approval rating (aforementioned Q-Poll) would cost him the election.


NORTH DAKOTA

If polling were the only factor in determining race outlook, then North Dakota would be the Republicans’ best conversion opportunity. Though polls have been anything but plentiful, those that have been published find at-large Rep. Kevin Cramer (R-Bismarck) leading incumbent Sen. Heidi Heitkamp (D).

The most recent study came in early September from Fox News (Sept. 8-11; 701 likely North Dakota voters) and finds Rep. Cramer holding a 48-44 percent advantage. This is the first survey release since the beginning of July.

The North Dakota race is a strong Republican conversion opportunity, but though Cramer appears to have a discernible edge right now, this contest is far from over.


Continue reading