Tag Archives: President George W. Bush

Job Approval: A Poor Indicator

By Jim Ellis — Monday, May 8, 2023

President

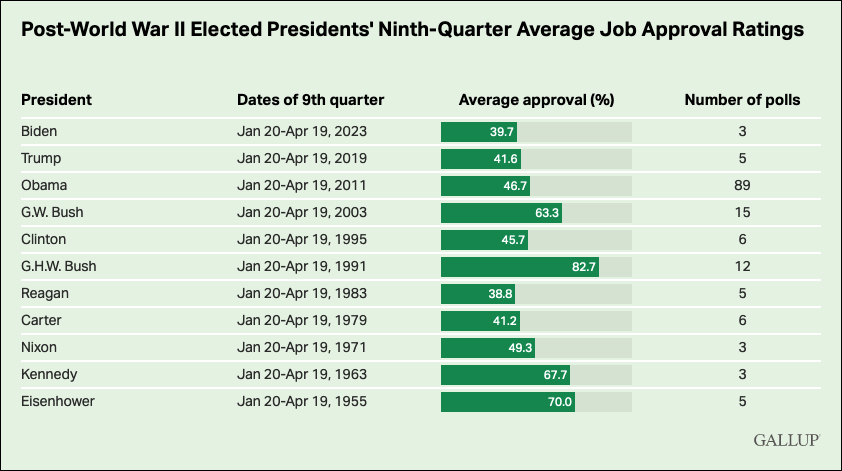
Polling Numbers: The Good, The Bad & The Ugly — The Gallup organization last week released their historical comparison of commensurate modern-era presidential job approval ratings, and it appears that a high positive score is not necessarily a prerequisite for winning re-election; nor is a poor one a precursor for defeat.

Gallup listed the presidents from Joe Biden back through Dwight Eisenhower and captured their mean average job approval ratings from the period between January 20 and April 19 of the year prior to them seeking re-election. Presidents Gerald Ford, John Kennedy, and Lyndon Johnson are not included because they were either not in office during the sampled period (Ford) or did not seek re-election (Kennedy because he was assassinated, while Johnson chose not to run for a second full term).

Looking at the Gallup number for each tested president (the posted figure representing the average polling result for the number of surveys conducted during the aforementioned testing period), President Biden is the worst performer at 38.7 percent favorable; George H.W. Bush, at 82.7 percent, was rated the best.

As you can see solely from that data point, even having the best job performance rating in the early part of the year prior to re-election is no guarantee of winning. While Bush had one of the highest positive ratings on record, he would then post the lowest popular vote percentage (37.5) and the second-lowest electoral vote total (168) of the nine presidents who ran for re-election after 1950.

The reverse is true, as well. The second-worst job approval rating at a commensurate period in his presidency is Ronald Reagan’s 38.8 percent positive score. Reagan would then rebound to the point of recording the strongest re-election electoral vote total (525 of the 538 available votes) in modern political history, and the second-highest popular vote score at 58.8 percent. The only president who outperformed Reagan in terms of a percentage of aggregate votes recorded was Richard Nixon’s 60.7 percent in 1972. Less than two years later, however, Nixon would be forced to resign in disgrace over the Watergate scandal.

Of the nine presidents since 1950 who ran for a second term, six were re-elected (Eisenhower, Nixon, Reagan, Bill Clinton, George W. Bush, and Barack Obama). Three were defeated (Jimmy Carter, George H.W. Bush, and Donald Trump).

In terms of those defeated, Carter’s job approval rating during the tested period was 41.2 percent, Bushes, as cited above, was 82.7 percent, while Trump’s was 46.8 percent.

Interestingly, both Bush’s significantly under-performed in their re-elections. George H.W. Bush dropped 45.2 points from his job approval score in the first quarter of the year before re-election compared to his popular vote total. His son, George W. Bush, was second in this category. While winning a second term with 50.7 percent of the vote, he dropped 12.6 points from his average first quarter 2003 job approval score of 63.3 percent. President Carter came the closest between early job approval, 41.2 percent, and his re-election popular vote total, 41.0 percent. His 49 electoral vote total in 1980, however, was by far the worst among the tested presidents.

Among those 10 presidents, including Biden, the average approval rating is 51.8 percent positive, while the average succeeding popular vote total was 50.3 percent (54.6 percent among the six winning presidents; 41.8 percent among the three losing chief executives).

While it is obviously better to be in a stronger job approval position heading into an election, having an upside-down ratio is not always disastrous. Conversely, as we’ve seen from the Bushes, posting high approval ratings the year prior to re-election is also no guarantee of success at the ballot box.

The fact that President Biden is on the low end of the approval rating index at this point in his presidency is not necessarily a cause for panic for Democrats, nor is it an ironclad prediction factor that he will lose the 2024 election. It is an indication, however, that he will have to pick up the pace of creating a better image and improving his perceived success rate regarding the handling of key issues.

Winning vs. Ideology

By Jim Ellis

Nov. 21, 2019 — As the 10 Democratic presidential candidates again took the debate stage last night, this time from Atlanta, they all needed recognize a few things: They needed to walk a fine line. The contenders needed to carefully navigate between appealing to their party’s ideological base, which is key to winning the nomination, and preparing for the general election where a more centrist approach appears to be the probable course toward achieving national victory.

The Gallup organization just completed a new national survey (Nov. 1-14; 1,015 US adults from all 50 states and the District of Columbia, 437 self-identified Democrats and Independents who lean Democratic) that compared the importance between choosing an ideologically sound nominee with one who is best equipped to win the general election irrespective of where that individual stands on the party’s base issues.

Looking at the current results in the prism of Gallup asking the same questions of Republican respondents when President Obama was running for re-election in 2012, and a Democratic cell group when President George W. Bush was seeking a second term in 2004, this sample skews towards electability over ideology in the starkest proportion.

According to Gallup’s questions asked of Democrats and lean Democrats whether they believed it is more important to find a candidate who can unseat President Trump or one who agrees with the individual respondent on issues, by a margin of 60-36 percent the poll showed that the favored candidate would be the one having the best chance to win the November 2020 election.

In 2012, Republican responses to this choice involving replacing President Obama, surveyed in mid-September of 2011, leaned toward a candidate who could win over the ideologically pure contender in a 53-43 percent spread. Eight years earlier, when President Bush was seeking his second term, the ratio among Democrats at the end of 2003 was 50-44 percent in favor of ideology, but six weeks later, in early February 2004, the margin switched to 55-40 percent toward finding the candidate who was best equipped to unseat Bush.

Continue reading

Ohio: Contrasting Polls

By Jim Ellis

state-of-ohio-mapNov. 1, 2018 — The Buckeye State of Ohio is viewed as one of the country’s quintessential swing states. In 2016, however, the state exceeded polling and even Republican expectations in their presidential vote, as President Trump won a decisive 52-44 percent victory over Hillary Clinton.

Some suggested the Trump vote was an indication that the state could be moving more definitively to the political right, but new surveys suggest the Buckeye electorate is returning to its previous swing vote history.

Still, Ohio proves a reliable national political barometer. In both 2008 and 2012, the electorate here voted for President Obama after twice after backing President George W. Bush in his two elections. The state previously favored President Bill Clinton in his two successful national campaigns. In fact, the last time Ohioans failed to vote for the winning presidential candidate came in 1960 when the state awarded its electoral votes to Republican Richard Nixon in his national losing effort against John F. Kennedy.

Two new polls were released this week that paint different pictures of the Ohio electorate’s current state. Some of the results are curious to the point of questioning the polling reliability or not being able to adequately determine how the governor’s race will end and failing to understand the wide discrepancy in US Senate polling projections.

Continue reading

Stapleton In, Coffman Out
in Race for Colorado Governor

By Jim Ellis

April 18, 2018 — Colorado Attorney General Cynthia Coffman (R), the wife of US Rep. Mike Coffman (R-Aurora), launched a campaign for governor in September, but her effort ended over the weekend when she failed to obtain a ballot position at the state convention.

Colorado state Treasurer Walker Stapleton

Colorado state Treasurer Walker Stapleton


Republican delegates from around the state gathered at the party Assembly to award ballot positioning. To qualify as a primary candidate in the Centennial State, an individual must receive at least 30 percent of the delegates’ votes. Or, one can secure petition signatures from 1,500 registered party members in each of the state’s seven congressional districts.

Short of funds at the end of the year when the signature gathering process began, Coffman decided only to access the ballot through convention support. Many candidates choose both avenues, using the signatures as political insurance in case they fall short at the convention. Though the sitting attorney general, Coffman received just six percent delegate support, meaning that she now has no way of participating in the gubernatorial primary. Because her own office is also on the ballot, AG Coffman now has no place to run.

At the other end of the spectrum, state Treasurer Walker Stapleton, a cousin of former President George W. Bush, also began to see his aspirations crumble before the convention but managed to rebound. While attempting to secure ballot access via petition, Stapleton discovered fraudulent signatures among those his contracted consulting firm gathered. He then took the unprecedented step of going to the Secretary of State and asking that all of his signatures be withdrawn. He then quickly entered the convention hoping to secure the 30 percent support factor just two days before the official conclave began.

Continue reading

The First Midterm: A Deeper Story

By Jim Ellis

July 18, 2017 — Much has been made about a new president’s party failing in the midterm directly after his initial national election, but the statistics aren’t quite what they seem. In the House, the average loss for the new president’s party is 26 seats in first midterm during the modern political era, in addition to dropping two Senate seats. But these numbers are misleading.

Many media stories portray the Democrats on the brink of wresting the House majority away from Republicans, and one factor supporting such a claim is the first midterm historical trend. The stories underscore that the Democrats need a net gain of 24 seats to depose the Republicans, two seats less than the average “out party” gain in similar elections.

The research stops short, however, and omits a very key point. Since President Harry S. Truman assumed office in 1945 and stood for election in his own right in 1948, 11 presidents, inclusive, have seen his party lose House seats in first midterm election. President Gerald Ford, because he was never elected to the office, is not included for purposes of this statistical exercise.

Continue reading

Pearce in Range in New Mexico

By Jim Ellis

June 8, 2017
— A statewide New Mexico poll released late last week suggests that US Rep. Steve Pearce (R-Hobbs) is well within the competitive range of fellow US Rep. Michelle Lujan Grisham (D-Albuquerque), should the two battle each other in next year’s open race for governor of New Mexico.

In December, Grisham announced that she would not seek re-election to the House, instead declaring for governor. She is the leading Democratic candidate, particularly now since Attorney General Hector Balderas, who would have been a credible gubernatorial contender, announced instead that he would seek re-election and support the congresswoman’s statewide bid. Republican Gov. Susana Martinez is ineligible to seek a third term, and the lack of an incumbent in the 2018 campaign for the state’s top public office has ignited a game of political musical chairs.

Pearce, who represents the southernmost of the three Land of Enchantment congressional districts, and the state’s only Republican seat, confirms that he is considering the gubernatorial race. He was first elected to the House in 2002, and then vacated to run for US Senate in 2008, upsetting his congressional colleague, then-Rep. Heather Wilson (R-Albuquerque), in the Republican primary but losing the general election badly to the state’s third House member, Tom Udall (D-Santa Fe), 61-39 perent. Pearce returned to the House in the 2010 election, unseating one-term Democratic Rep. Harry Teague.

Continue reading

Polarized, or Not?

By Jim Ellis

March 1, 2017 — Much is being made about President Trump’s early job approval ratings. Almost across the board, they are low, and particularly so for a new national chief executive, which has naturally attracted media attention.

In their late February report about political polarization, the Gallup polling organization, which began testing presidential job approval back in the Truman Administration and has regularly continued the practice ever since, argues that polarization among the self-identified Republicans and Democrats is a major obstacle for President Trump to overcome. They further make the point that this is not a new phenomenon, as partisan approval polling detected similar numbers for presidents Barack Obama and George W. Bush.

The Gallup analysis, on and around the Feb. 20 time frame, found President Trump’s job approval rating to be 42 percent. When they looked at the two previous presidents, also hitting 42 percent approval rating at certain points in their own presidencies, Gallup found the level of partisan support and opposition among Democrats and Republicans for the president of their own party was virtually identical.

Continue reading