Tag Archives: United States Election Project

More Election Eve Updates

By Jim Ellis

Nov. 8, 2018 — According to a CBS News report quoting University of Florida professor Michael McDonald, who runs the United States Election Project, more than 113 million people voted in the 2018 midterm election, the first time turnout exceed the 100 million mark.

With voter participation approaching a majority of the eligible voting population for the first time since 1966, we see a continued increase in voter participation. The 2018 midterm is among the three top off-year elections with the highest turnout rate in the past 118 years. This high voting trend has largely been in effect since the 2000 election, though the 2014 midterm proved an exception with very low turnout.

Carrying through from media projections of uncalled races, it appears the Democrats will see a net gain of 31 seats, not counting the California races that still have millions of votes to tabulate. An incumbent race featuring New Jersey Rep. Tom MacArthur (R-Toms River) appears to be flipping back and forth in final counting.

The Golden State features an election system where at least 75 percent of the people vote through the mail and they allow ballots to be postmarked on Election Day. Therefore, it will be a couple of full weeks before we know the final totals in what appears to be five congressional contests that are still undecided, all in current Republican seats. It is probable that the Democrats will win at least two of the five and possibly even all of them.

Continue reading

Ohio: Contrasting Polls

By Jim Ellis

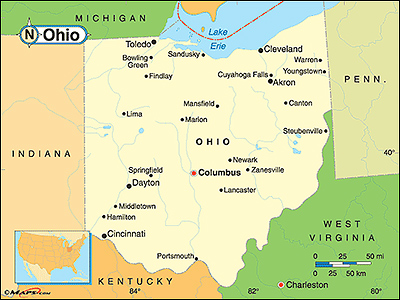
state-of-ohio-mapNov. 1, 2018 — The Buckeye State of Ohio is viewed as one of the country’s quintessential swing states. In 2016, however, the state exceeded polling and even Republican expectations in their presidential vote, as President Trump won a decisive 52-44 percent victory over Hillary Clinton.

Some suggested the Trump vote was an indication that the state could be moving more definitively to the political right, but new surveys suggest the Buckeye electorate is returning to its previous swing vote history.

Still, Ohio proves a reliable national political barometer. In both 2008 and 2012, the electorate here voted for President Obama after twice after backing President George W. Bush in his two elections. The state previously favored President Bill Clinton in his two successful national campaigns. In fact, the last time Ohioans failed to vote for the winning presidential candidate came in 1960 when the state awarded its electoral votes to Republican Richard Nixon in his national losing effort against John F. Kennedy.

Two new polls were released this week that paint different pictures of the Ohio electorate’s current state. Some of the results are curious to the point of questioning the polling reliability or not being able to adequately determine how the governor’s race will end and failing to understand the wide discrepancy in US Senate polling projections.

Continue reading

National Early Voting Report

By Jim Ellis

i-vote-i-countOct. 31, 2018 — Now more than halfway through the early voting period in the 37 states that offer early voting options for the populace, some places are turning in record participation rates. Each state has various nuances in their early voting procedures, so comparing the early reports to each other is of little value. Going back to contrast the current 2018 reported numbers with how that particular state voted in the last midterm election (2014) does have significance, however.

Already, in the latest available reports according to the United States Election Project administered by the personnel at the University of Florida, seven states are reporting more received early voting ballots than were recorded for the entire 2014 pre-election period. They are:

• Tennessee – 162.3% more ballots (1,029,846 versus 634,364 recorded in 2014)
• Texas – 144.3% increase (2,980,915 versus 2,066,368 recorded in 2014)
• Indiana – 127.9% increase (292,726 versus 228,932 recorded in 2014)
• Nevada – 122.5% increase (372,455 versus 304,005 recorded in 2014)
• Georgia – 111.1% increase (1,188,636 versus 1,069,912 recorded in 2014)
• Minnesota – 106.0% increase (249,909 versus 235,808 recorded in 2014)
• Delaware – 103.2% more ballots (8,550 versus 8,288 recorded in 2014)


An additional seven states have so far recorded better than 85 percent of their early voting total in comparison to their entire 2014 pre-election voting universe:

• North Carolina – 97.1% of previous (1,140,657 versus 1,174,188 recorded in 2014)
• Virginia – 94.2% of previous total (191,755 versus 203,556 recorded in 2014)
Continue reading