Tag Archives: President Trump

Missouri Sen. Roy Blunt to Retire

By Jim Ellis

Missouri Sen. Roy Blunt (R)

March 10, 2021 — Missouri Sen. Roy Blunt (R) announced via video yesterday that he is not seeking a third term next year. He will conclude an era of elected public service that spanned 14 years in the House in addition to completing a dozen years in the Senate. Prior to his federal career, he served as Missouri’s secretary of state, was the Greene County clerk, ran for governor, and saw his son elected governor.

The Blunt exit brings the number of Republican open Senate seats to five and could soon go to seven if Sens. Chuck Grassley (R-IA) and Ron Johnson (R-WI) follow suit. Sen. Grassley will turn 89 years of age before the next election, and Sen. Johnson originally made a two-term promise when he first ran in 2010. The other announced GOP retirees are Sens. Richard Burr (NC), Pat Toomey (PA), Rob Portman (OH), and Richard Shelby (AL).

Without Sen. Blunt in the 2022 race, we can expect a contested Republican primary. Potential candidates include Lt. Gov. Mike Kehoe, Secretary of State Jay Ashcroft, the son of former senator and US Attorney General John Ashcroft, and US Reps. Ann Wagner (R-Ballwin/St. Louis County), Blaine Luetkemeyer (R-St. Elizabeth/Jefferson City), Sam Graves (R-Tarkio/St. Joseph), Billy Long (R-Springfield), and Jason Smith (R-Salem/Southeast MO) among others.

Resigned Gov. Eric Greitens, who was forced from office due to a sex scandal, was beginning to talk about launching a primary against Sen. Blunt, so in an open-seat situation he will be another person whose name will regularly surface.

We’re seeing almost the opposite response among Democrats. The initial public comments from two of the most well-known Missouri Dems, former Sen. Claire McCaskill and 2016 nominee Jason Kander, who held Sen. Blunt to a tight 49-46 percent win in 2016, both immediately indicated that they will not run in 2022. Thus, a previously announced Senate candidate, former state Sen. Scott Sifton, apparently becomes the early leader for the party nomination.

Continue reading

New York Voting Patterns

New York’s Congressional Districts

By Jim Ellis

Feb. 11, 2021 — The Daily Kos Elections researchers are converting the 2020 presidential returns into congressional district totals, as they have successfully done in past election years. This allows us to compare the 2020 voting patterns with those from four years ago. Doing so reveals some interesting conclusions.

As you can see from the chart below of all 27 New York congressional seats, the patterns are striking, and while former President Trump met and exceeded his projected vote goals within his worst performing districts in New York City, he underperformed by similar ratios in the regions that should have been his strongest.

The NY congressional delegation is split 19-8 in the Democrats’ favor. When comparing the districts that President Joe Biden and former President Trump each won, we see that they match almost identically to the partisan choices those electorates made for the House of Representatives.

There is one exception, however, in addition to a pair of districts that Trump carried in 2016 but switched to President Biden in 2020. The Syracuse-anchored congressional seat that Republican John Katko (R) represents is the only New York district that split its presidential and congressional vote.

While Biden was carrying the CD with a nine-point margin, a net 3.6 percent Democratic improvement from Hillary Clinton’s 2016 result in this 24th District, Rep. Katko was re-elected to a fourth term with a 52-42 percent margin over college professor Dana Balter (D), his 2018 opponent who returned for a re-match. The result was a net four-point improvement for the GOP incumbent from 2018 his victory.

The two seats Trump won in 2016 that switched to President Biden in 2020 are the 18th and 19th Districts, those of Reps. Sean Patrick Maloney (D-Cold Spring/Peekskill) and Antonio Delgado (D-Rhinebeck) — CDs that bridge the city districts with those in the upstate region.

As the chart below shows, the striking point is that the net gains or losses in almost every 2020 district when compared to 2016 is almost opposite of what an analyst would have predicted. Former President Trump underperformed on Long Island as well as upstate, areas where he should have shown greater strength; and he over-performed in all of the New York City districts.

Trump lost the NYC seats by substantial margins, a heavily minority region, but his improvement ranged from a net 0.5 percent in Rep. Carolyn Maloney’s (D-Manhattan) Silk Stocking district to 15.5 percent in the Bronx CD of freshman Rep. Ritchie Torres (D). Four years ago, the latter NY-15 CD was the former president’s worst-performing district in the entire country.

These particular results show that despite the media image of Trump being America’s most racist president, the numbers generally depict clear improvement among people of color in New York State.

The explanation for his lesser performance on Long Island and upstate traces back to a familiar Trump 2020 problem: performing worse among women, those aged 65 years and older, in addition to right-of-center unaffiliated and minor party voters. It was his failure to equal his 2016 performance with these voting segments that cost him his re-election victory.

As we look at other numbers from across the country, we will see the patterns uncovered in New York also becoming prevalent in most other regions.


New York

INCUMBENT BIDEN ’20 CLINTON ’16 TRUMP ’20 TRUMP ’16 NET
1 – ZELDIN 47.3 42.2 51.5 54.5 8.1
2 – GARBARINO 47.4 43.9 53.0 51.6 2.1
3 – SUOZZI 54.7 51.6 44.3 45.5 4.6
4 – RICE 55.6 53.4 43.4 43.8 2.6
5 – MEEKS 83.3 85.7 16.2 12.7 5.9
6 – MENG 61.8 65.1 37.4 32.1 8.6
7 – VAZQUEZ 81.8 84.6 16.5 13.5 4.4
8 – JEFFRIES 82.9 86.9 17.3 10.4 12.0
9 – CLARKE 81.4 83.5 17.8 14.4 5.5
10 – NADLER 76.1 78.3 22.9 18.8 6.3
11 – MALLIOTAKIS 44.3 43.8 54.8 53.6 0.7
12 – MALONEY, C. 84.1 83.3 14.8 13.5 0.5
13 – ESPAILLAT 88.1 92.3 11.2 5.4 10.0
14 – OCCASIO-CORTEZ 73.3 77.7 25.9 19.8 10.5
15 – TORRES 86.5 93.8 13.1 4.9 15.5
16 – BOWMAN 75.3 75.1 23.8 22.5 1.1
17 – JONES 59.6 58.6 39.4 38.4 0.0
18 – JONES 51.8 47.1 46.8 49.0 6.9
19 – DELGADO 49.8 44.0 48.3 50.8 8.3
20 – TONKO 59.3 54.0 38.7 40.5 7.1
21 – STEFANIK 43.8 40.0 54.2 53.9 3.5
22 – TENNEY 43.3 39.3 54.7 54.8 3.9
23 – REED 43.3 39.7 54.6 54.5 3.5
24 – KATKO 53.4 48.9 44.4 45.3 3.6
25 – MORRELLE 60.1 55.5 37.8 39.1 5.9
26 – HIGGINS 62.6 57.6 35.6 38.0 7.4
27 – JACOBS 41.1 35.2 56.8 59.7 8.8

Ohio Sen. Portman to Retire

By Jim Ellis

Ohio Sen. Rob Portman (R) surprisingly announced his retirement Monday.

Jan. 27, 2021 — Ohio Sen. Rob Portman (R) surprisingly announced Monday that he will not seek a third term next year, opening the third Senate seat for the 2022 election cycle.

Addressing reporters at a news conference in Cincinnati yesterday, Sen. Portman said, “Our country’s polarized right now. It’s kind of shirts and skins. That makes it more difficult to find that common ground. Elected officials aren’t rewarded for that. What they’re rewarded for is throwing red meat to the talk show.”

The two-term senator indicated that the “partisan gridlock” is one of the reasons for his retirement. He further said in explaining his retirement decision, “we just keep pushing out to the right and to the left, there’s not going to be much left in the middle to solve the real problems we face.”

For the Republicans, they now have three big state open seats to defend as Sen. Portman joins Pennsylvania GOP Sen. Pat Toomey and North Carolina’s Richard Burr as incumbents who have already made their 2022 retirement plans public. Several others could be on the horizon.

Senators Richard Shelby (R-AL) and Chuck Grassley (R-IA) will be 88 and 89 years of age, respectively, at the time of the next election, and Wisconsin Sen. Ron Johnson (R) originally took a two-term pledge when he was first elected in 2010. None of these three lawmakers have made their future political plans public to date, however.

Ohio, once a bedrock Republican state, developed a swing image beginning in 1992 when the state deserted GOP President George H.W. Bush and backed Democrat Bill Clinton. They did so again in 1996. In 2000 and 2004, Ohio returned to the Republican column awarding George W. Bush with its electoral votes. In 2008 and 2012, the Buckeye State ventured back to the Democratic side of the political ledger, supporting Barack Obama in both of his national elections.

Therefore, rather than being cast as a swing state during this 20 year period, Ohio may actually have been a microcosm of the national electorate since the state’s voters chose the winning candidate in each of the presidential elections during that time span, and had done likewise for the three previous decades.

Continue reading

Comparing 2020 & 2016

By Jim Ellis

Jan. 15, 2021 — Now that the presidential numbers are final and certified in all 50 states, we can begin to draw comparisons between the two Trump election years and see the states where movement was most significant.

The 2020 election results show interesting parallels in the race between President Donald Trump and President-Elect Joe Biden and the 2016 race between Trump and Hillary Clinton.

A total of 158,507,118 people are recorded as voting in the 2020 election, an all-time record. In 2016, by comparison, 136,792,535 individuals cast ballots. The current total represents an increase of 15.9 percent. Even those forecasting a turnout of just above 155 million, which seemed outlandish at the time, were low as the 2020 aggregate final vote widely cleared all previous electoral participation records.

As you will see from the following charts, most states performed similarly in 2020 as they did in 2016. In the preponderance of places, both President Trump and President-Elect Joe Biden posted better percentages in 2020, though Trump recorded slightly lower 2020 percentages in 13 states as compared to Biden falling below 2016 Democratic nominee Hillary Clinton in only one (Mississippi).

The change factors are largely due to lesser independent and minor party candidates on the 2020 ballot as opposed to 2016 and an increase in first-time voters.

Nationally, as determined in all 50 states, President Trump’s numbers increased an average of one percentage point per state, while Biden saw a mean average four percent jump over Clinton’s standing.

The first charts depict President Trump’s state totals in alphabetical order. To reiterate, his per state average gain was 1.0 percent. The second chart shows the states in order of the largest gains.

The succeeding Democratic charts illustrate Biden’s increased performance over that of Clinton. Though his national per state victory margin over President Trump was low in comparison to 2016 – changing Arizona, Georgia, Wisconsin and the 2nd District of Nebraska would have changed the national outcome and the aggregate vote margin was only 65,009 – his standing in every state was significantly better than hers. The Biden average per state gain was 4.0 percent.

REPUBLICAN

Alphabetical

STATE 2016 R 2020 R AVG GAIN
Alabama 62.1% 62.3% 0.2%
Alaska 51.3% 52.8% 1.5%
Arizona 48.7% 49.1% 0.4%
Arkansas 60.6% 62.4% 1.8%
California 31.6% 34.3% 2.7%
Colorado 43.2% 41.9% -1.3%
Connecticut 40.9% 39.2% -1.7%
Delaware 41.7% 39.8% -1.9%
Florida 49.0% 51.2% 2.2%
Georgia 50.8% 49.2% -1.6%
Hawaii 29.4% 33.9% 4.5%
Idaho 59.3% 63.8% 4.5%
Illinois 38.8% 40.6% 1.8%
Indiana 56.9% 57.0% 0.1%
Iowa 51.2% 52.8% 1.6%
Kansas 56.6% 56.2% -0.4%
Kentucky 62.5% 62.1% -0.4%
Louisiana 58.1% 58.5% 0.4%
Maine 43.5% 43.6% 0.1%
Maryland 33.9% 32.2% -1.7%
Massachusetts 32.3% 39.1% 6.8%
Michigan 47.6% 47.8% 0.2%
Minnesota 44.9% 45.3% 0.4%
Mississippi 57.9% 41.1% -0.3%
Missouri 56.8% 56.8% 0.0%
Montana 56.2% 56.9% 0.7%
Nebraska 58.7% 58.2% -0.5%
Nevada 45.5% 47.8% 2.3%
New Hampshire 46.5% 45.4% -1.1%
New Jersey 41.4% 41.4% 0.0%
New Mexico 40.0% 43.5% 3.5%
New York 36.1% 37.5% 1.4%
North Carolina 49.8% 49.9% 0.1%
North Dakota 65.1% 31.8% 2.1%
Ohio 51.7% 53.3% 1.6%
Oklahoma 65.3% 65.4% 0.1%
Oregon 40.4% 56.5% 0.7%
Pennsylvania 48.6% 48.8% 0.2%
Rhode Island 38.9% 38.6% -0.3%
South Carolina 54.9% 55.1% 0.2%
South Dakota 61.5% 61.8% 0.3%
Tennessee 60.7% 60.7% 0.0%
Texas 53.2% 52.1% -1.1%
Utah 45.5% 58.1% 12.6%
Vermont 29.8% 30.9% 1.1%
Virginia 44.4% 44.0% -0.4%
Washington 36.8% 38.8% 2.0%
West Virginia 68.6% 68.7% 0.1%
Wisconsin 47.2% 48.8% 1.6%
Wyoming 67.4% 69.5% 2.1%

Performance Increase

STATE 2016 R 2020 R AVG GAIN
Utah 45.5% 58.1% 12.6%
Massachusetts 32.3% 39.1% 6.8%
Hawaii 29.4% 33.9% 4.5%
Idaho 59.3% 63.8% 4.5%
New Mexico 40.0% 43.5% 3.5%
California 31.6% 34.3% 2.7%
Nevada 45.5% 47.8% 2.3%
Florida 49.0% 51.2% 2.2%
North Dakota 65.1% 31.8% 2.1%
Wyoming 67.4% 69.5% 2.1%
Washington 36.8% 38.8% 2.0%
Arkansas 60.6% 62.4% 1.8%
Illinois 38.8% 40.6% 1.8%
Iowa 51.2% 52.8% 1.6%
Ohio 51.7% 53.3% 1.6%
Wisconsin 47.2% 48.8% 1.6%
Alaska 51.3% 52.8% 1.5%
New York 36.1% 37.5% 1.4%
Vermont 29.8% 30.9% 1.1%
Oregon 40.4% 56.5% 0.7%
Montana 56.2% 56.9% 0.7%
Arizona 48.7% 49.1% 0.4%
Louisiana 58.1% 58.5% 0.4%
Minnesota 44.9% 45.3% 0.4%
South Dakota 61.5% 61.8% 0.3%
Alabama 62.1% 62.3% 0.2%
Michigan 47.6% 47.8% 0.2%
Pennsylvania 48.6% 48.8% 0.2%
South Carolina 54.9% 55.1% 0.2%
Indiana 56.9% 57.0% 0.1%
Maine 43.5% 43.6% 0.1%
North Carolina 49.8% 49.9% 0.1%
Oklahoma 65.3% 65.4% 0.1%
West Virginia 68.6% 68.7% 0.1%
Missouri 56.8% 56.8% 0.0%
New Jersey 41.4% 41.4% 0.0%
Tennessee 60.7% 60.7% 0.0%
Mississippi 57.9% 41.1% -0.3%
Rhode Island 38.9% 38.6% -0.3%
Kansas 56.6% 56.2% -0.4%
Kentucky 62.5% 62.1% -0.4%
Virginia 44.4% 44.0% -0.4%
Nebraska 58.7% 58.2% -0.5%
New Hampshire 46.5% 45.4% -1.1%
Texas 53.2% 52.1% -1.1%
Colorado 43.2% 41.9% -1.3%
Georgia 50.8% 49.2% -1.6%
Connecticut 40.9% 39.2% -1.7%
Maryland 33.9% 32.2% -1.7%
Delaware 41.7% 39.8% -1.9%

DEMOCRAT

Alphabetical

STATE 2016 D 2020 D AVG GAIN
Alabama 34.4% 36.6% 2.2%
Alaska 36.5% 42.8% 6.3%
Arizona 45.1% 49.4% 4.3%
Arkansas 33.6% 34.8% 1.2%
California 61.7% 63.5% 1.8%
Colorado 48.2% 55.4% 7.2%
Connecticut 54.6% 59.2% 4.6%
Delaware 53.1% 58.7% 5.6%
Florida 47.8% 47.9% 0.1%
Georgia 45.6% 49.5% 3.9%
Hawaii 61.0% 63.1% 2.1%
Idaho 27.5% 33.1% 5.6%
Illinois 55.8% 57.5% 1.7%
Indiana 37.8% 41.0% 3.2%
Iowa 41.7% 3.2% 3.0%
Kansas 36.0% 41.6% 5.6%
Kentucky 32.7% 36.1% 3.4%
Louisiana 38.4% 39.8% 1.4%
Maine 46.4% 52.5% 6.1%
Maryland 60.3% 65.4% 5.1%
Massachusetts 59.0% 65.1% 6.1%
Michigan 47.3% 50.6% 3.3%
Minnesota 46.4% 52.4% 6.0%
Mississippi 57.6% 40.1% -1.0%
Missouri 38.1% 41.4% 3.3%
Montana 35.7% 40.6% 4.9%
Nebraska 33.7% 39.2% 5.5%
Nevada 47.9% 50.1% 2.2%
New Hampshire 46.8% 52.7% 5.9%
New Jersey 55.5% 57.3% 1.8%
New Mexico 48.3% 54.3% 6.0%
New York 58.4% 60.4% 2.0%
North Carolina 46.2% 48.6% 2.4%
North Dakota 63.0% 27.2% 4.6%
Ohio 43.6% 45.2% 1.6%
Oklahoma 28.9% 32.3% 3.4%
Oregon 39.1% 50.1% 6.4%
Pennsylvania 47.8% 50.0% 2.2%
Rhode Island 54.4% 59.4% 5.0%
South Carolina 40.7% 43.4% 2.7%
South Dakota 31.7% 35.6% 3.9%
Tennessee 34.7% 37.5% 2.8%
Texas 43.2% 46.5% 3.3%
Utah 27.5% 37.7% 10.2%
Vermont 55.7% 65.5% 9.8%
Virginia 49.7% 54.1% 4.4%
Washington 52.5% 58.0% 5.5%
West Virginia 26.5% 29.7% 3.2%
Wisconsin 46.5% 49.4% 2.9%
Wyoming 21.6% 26.4% 4.8%

Performance Increase

STATE 2016 D 2020 D AVG GAIN
Utah 27.5% 37.7% 10.2%
Vermont 55.7% 65.5% 9.8%
Colorado 48.2% 55.4% 7.2%
Oregon 39.1% 50.1% 6.4%
Alaska 36.5% 42.8% 6.3%
Massachusetts 59.0% 65.1% 6.1%
Maine 46.4% 52.5% 6.1%
New Mexico 48.3% 54.3% 6.0%
Minnesota 46.4% 52.4% 6.0%
New Hampshire 46.8% 52.7% 5.9%
Idaho 27.5% 33.1% 5.6%
Kansas 36.0% 41.6% 5.6%
Delaware 53.1% 58.7% 5.6%
Nebraska 33.7% 39.2% 5.5%
Washington 52.5% 58.0% 5.5%
Maryland 60.3% 65.4% 5.1%
Rhode Island 54.4% 59.4% 5.0%
Montana 35.7% 40.6% 4.9%
Wyoming 21.6% 26.4% 4.8%
North Dakota 63.0% 27.2% 4.6%
Connecticut 54.6% 59.2% 4.6%
Virginia 49.7% 54.1% 4.4%
Arizona 45.1% 49.4% 4.3%
Georgia 45.6% 49.5% 3.9%
South Dakota 31.7% 35.6% 3.9%
Oklahoma 28.9% 32.3% 3.4%
Kentucky 32.7% 36.1% 3.4%
Michigan 47.3% 50.6% 3.3%
Texas 43.2% 46.5% 3.3%
Missouri 38.1% 41.4% 3.3%
Indiana 37.8% 41.0% 3.2%
West Virginia 26.5% 29.7% 3.2%
Iowa 41.7% 44.7% 3.0%
Wisconsin 46.5% 49.4% 2.9%
Tennessee 34.7% 37.5% 2.8%
South Carolina 40.7% 43.4% 2.7%
North Carolina 46.2% 48.6% 2.4%
Alabama 34.4% 36.6% 2.2%
Nevada 47.9% 50.1% 2.2%
Pennsylvania 47.8% 50.0% 2.2%
Hawaii 61.0% 63.1% 2.1%
New York 58.4% 60.4% 2.0%
California 61.7% 63.5% 1.8%
New Jersey 55.5% 57.3% 1.8%
Illinois 55.8% 57.5% 1.7%
Ohio 43.6% 45.2% 1.6%
Louisiana 38.4% 39.8% 1.4%
Arkansas 33.6% 34.8% 1.2%
Florida 47.8% 47.9% 0.1%
Mississippi 57.6% 40.1% -1.0%

Early Senate 2022 Previews:
Florida & North Carolina

By Jim Ellis

Jan. 14, 2021 — Regardless of how many in-cycle Senate seats – there are 34 in the 2022 election cycle – come into political play, we can count on seeing Florida and North Carolina once again hosting crucial battleground campaigns.

Florida is always consistent in their close vote totals, particularly when remembering the 2000 presidential campaign — and pollsters, while typically forecasting tight finishes, have often missed the outcomes. In fact, the cumulative polling community has predicted close Democratic victories in the last four key statewide elections: two presidential (2016 & 2020), one senatorial (2018), one gubernatorial (2018), and been wrong on each occasion.

Since 2016, inclusive, Florida has hosted eight statewide races with Republicans winning seven. Yet, their average cumulative vote percentage for these eight victorious campaigns was just 50.7 percent, with the high point being 52.0 percent (Sen. Marco Rubio-R, 2016). Democrats recorded the low winning total: 50.04 percent — 6,753 votes from 8,059,155 votes cast; agriculture commissioner, 2018; winner Nikki Fried (D) vs. Matt Caldwell (R). The aggregate average among the statewide contests in these three most recent election years is 50.7 – 47.9 percent in the GOP’s favor.

With this background, Sen. Rubio will presumably seek a third term next year against what will surely be a highly competitive Democratic opponent. At this point, most of the speculation surrounds two Democratic House members, neither of whom has closed the door on either running for the Senate or challenging Gov. Ron DeSantis (R) as he seeks a second term.

Reps. Stephanie Murphy (D-Winter Park) and Val Demings (D-Orlando) are the two most prominently mentioned prospective contenders, and it wouldn’t be surprising to see one run for Senate and the other for governor. It is less likely that we would see a primary developing between the pair in one of the races.

Other names being floated are Rep. Charlie Crist (D-St. Petersburg), who is always mentioned as a potential statewide candidate because he previously served both as attorney general and governor and lost two other statewide campaigns. Other potential contenders are Rep. Ted Deutch (D-Boca Raton) and former Rep. Debbie Mucarsel-Powell (D-Miami). The state’s lone Democratic office holder, Agriculture Commissioner Nikki Fried, is more often associated with running for governor as opposed to the Senate contest.

Continue reading

Florida Data

By Jim Ellis

Dec. 18, 2020 — Continuing with our project this week of analyzing statewide data now that official final election results are being published from around the country, today we look at the Sunshine State of Florida, another key redistricting state.

Though having only three-quarters of Texas’ population, the Florida presidential turnout came within only a few hundred to equaling that of the Lone Star State (FL: 11,067,366; TX: 11,315,056).

On the statewide tally, President Trump carried Florida with a 51.2 – 47.5 percent margin over former vice president Joe Biden. The result represents a net 2.2 percentage increase for the president when compared with his 2016 statewide total, while Biden’s performance registered a decline of 0.3 percent from Hillary Clinton’s Sunshine State aggregate vote.

The House performance detected in California and Texas, showing that the average victorious congressional candidate performed better within their particular district than President Trump, was not nearly as pronounced in Florida.

On average, Texas US House Republican candidates ran 2.8 percentage points better than Trump, and the average California GOP House candidate ran 4.2 points ahead of the president’s statewide percentage. In Florida, however, the number was virtually equal to the president’s, with the average House Republican contender running just 0.2 percent above Trump’s statewide total.

Because two of the Republican incumbents, Reps. Neal Dunn (R-Panama City) and Mario Diaz-Balart (R-Miami/Hialeah), ran either without Democratic opposition (Dunn) or totally unopposed (Diaz-Balart) the Florida Secretary of State does not record votes in such a district. Therefore, for purposes of this exercise, a projected result of 65-35 percent for the two congressional districts was added as an estimated total. This percentage spread was extrapolated when comparing the performance of Republican and Democratic congressional candidates in similar Florida districts.

To review, in California, Democratic House incumbent performance fell below their 2018 recorded vote in 33 of 44 districts, while results improved for four of the six Republican incumbents on the ballot. In Texas, vote percentages for 11 of the 16 Republican incumbents seeking re-election improved from 2018, while the Democratic incumbent performance index declined for all 13 who ran for a succeeding term.

Continue reading

Texas Data

By Jim Ellis

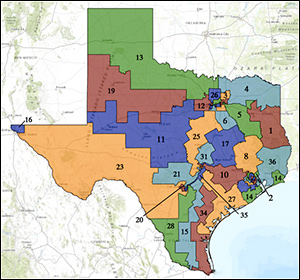
Texas US House Districts

Dec. 17, 2020 — Yesterday, we analyzed the California official 2020 Statement of the Vote and today we turn out attention to voting statistics from the Lone Star State of Texas, a particularly interesting domain for the coming redistricting process. Estimates project that Texas will gain three congressional districts from reapportionment, which should become official at some point in January.

Despite predictions of a “blue wave” hitting Texas and putting the state in play for Joe Biden, Republicans once again swept the competitive races. Though President Trump’s margin did decline from 2016, his 52-46 percent margin was still more than comfortable, especially when considering he was simultaneously losing the nationwide vote.

As was the case in California, down-ballot GOP candidates, as a rule, performed better than President Trump. Sen. John Cornyn (R) was re-elected, and the GOP won 23 congressional races in the state, accounting for almost 11 percent of their party’s national total.

Sen. Cornyn topped 53 percent of the vote in recording a nine-point win over his Democratic opponent, retired Army helicopter pilot M.J. Hegar. In the 23 victorious Republican House races, the winning GOP candidate outpaced President Trump in 19 districts most of which were competitive at least to a degree.

Compared with the Democratic improvement in elections two years ago, the GOP rebounded in 2020. A total of 16 Republican incumbents sought re-election, and 11 of those improved their vote percentages from 2018. Additionally, all five of those falling below their previous benchmark did so by less than one percentage point.

For the Democrats, all 13 of their House incumbents saw a downgrade in their voter support from 2018. Rep. Henry Cuellar (D-Laredo), who fought off a tough Democratic primary challenge in early March, saw the biggest drop for any Texas House incumbent, falling from 84.4 percent in 2018 to a 58.3 percent win in November. The more serious drop, however, was for Rep. Vicente Gonzalez (D-McAllen) who won re-election to a third term from his South Texas district with just 50.5 percent of the vote against an opponent who spent only $404,000. Gonzalez’s victory percentage slipped from 59.7 percent in 2018.

The TX-15 district is largely a Mexican border seat that starts just east San Antonio in the Seguin area and travels south all the way through the city of McAllen in Hidalgo County. The latter entity hosts three-quarters of the 15th District’s population. Republicans, including President Trump, improved their standing throughout the Mexican border area in the 2020 election, which was a principal reason that Democratic gains in the Dallas, Houston, Austin, and San Antonio metropolitan areas were somewhat offset.

Statewide turnout was up a strong 23.7 percent when compared to 2016, enabling the state to exceed 11 million voters (11,315,056) for the first time. The Texas population grew 3.9 percent during that same time interval.

Continue reading

Biden Elected; Calif. Data Published

By Jim Ellis

Dec. 16, 2020 — The Electoral College met in the various state capitols Monday, as scheduled, and the electors cast their ballots in the exact correlation with the state election data. Since the Electoral College increased to 538 members in time for the 1964 presidential election, we’ve seen faithless electors — those who vote for a candidate other than whom the state voters supported — in seven presidential elections.

No faithless elector appeared in Monday’s vote, however, meaning the final official count is Joe Biden, 306; President Trump, 232; the exact numbers produced on election night. The Supreme Court issued a ruling earlier in the year codifying that the states have the right to bind their electors. A total of 29 states and the District of Columbia had previously taken such action, so the court’s July 6, 2020 ruling in the Chiafalo v. Washington State case meant that these 30 entities’ votes would be forced to directly follow their respective electorates.

The remaining 21 states do not bind their electors, so those electors were still free to vote for someone outside of the Nov. 3 election totals. Monday, however, none did.

The action now means that Joe Biden is officially the President-Elect. The Electoral College will now report their results to the Congress on Jan. 6, 2021, where the votes will be counted and recorded. At that point, Biden will be officially elected and ready to take the oath of office as the 46th president of the United States on Jan. 20, 2021.

The California delegation is the group that put Biden over the top, allowing him to first clinch a majority vote in the Electoral College. Also coming from the Golden State is the official Statement of the Vote from the 2020 election, and it contains some interesting numbers to analyze.

Biden received more than 11.1 million votes in California, or 63.5 percent of the total ballots cast. President Trump obtained just over 6 million votes, good for 34.3 percent. Though the latter percentage is small, it is almost three full points beyond than his 2016 showing within the state.

Continue reading

Key States: President By CD

Daily Kos Elections – presidential results by congressional district. Click on image to see full interactive map at Daily Kos.

By Jim Ellis

Dec. 14, 2020 — The Daily Kos Elections organization is rapidly going through the election returns to provide a presidential vote depiction for every congressional district. At this point, they are only about a quarter of the way through the country but have already recorded some critical battleground states such as Iowa, Michigan, Nevada, Ohio, and Wisconsin.

Dividing the national presidential vote into individual congressional districts portends better analysis because patterns are easier to decipher and analyze in smaller geographic segments.

In the aforementioned five-state region, 46 congressional districts are housed. Turning to the November election, Republicans won 28 of the US House seats in these states while Democrats recorded 18 victories. Just two of the CDs, both in Iowa, switched parties, and went from Democrat to Republican.

In these decisive states, several interesting patterns became evident. What appears clear, in most instances, is President Trump improving upon his 2016 vote percentages and former vice president Joe Biden surpassing Hillary Clinton’s totals of four years ago in all but four of the 46 congressional districts.

Trump exceeded his 2016 percentage performance in 35 of the 46 districts and failed to do so in 11. This despite the fact that he would lose three of the five states studied in this exercise.

Perhaps the most indicative finding centers around President Trump’s standing when compared with the various Republican congressional candidates in all of the tested districts. The fact that he finished under the GOP congressional candidate’s percentage in 32 of the 46 CDs is significant and the key to understanding why he lost two of the states that he carried in 2016. The totals suggest that Republican elasticity in these 32 districts was greater than what the President achieved.

Such is particularly true in the state of Wisconsin, a place Trump lost this year by just over 20,000 votes of almost 3.3 million ballots cast, or only half a percentage point. When examining the eight Wisconsin federal districts, we see Trump running behind the Republican congressional candidate in all five of the GOP-held districts and in two of three Democratic seats.

Continue reading

Coasting on Trump’s Coattails?

By Jim Ellis

President Trump

Dec. 11, 2020 — When examining 21st century electoral behavior, in an overwhelming number of states, we find that voters are choosing the US Senate contender of the party whose presidential candidate carries their particular electorate, and the 2020 vote is mostly no exception to such a premise. This pattern allows the various presidential nominees to develop political coattails and potentially bring in additional members of his party to both the Senate and House.

In November, the only state where voters swayed from that pattern was Maine, where Pine Tree State voters broke 52-43 percent in favor of Democrat Joe Biden at the top of the ticket but returned to the Republican column to re-elect Sen. Susan Collins by a 50-42 percent margin. And, as we will see when examining the data below, in the 2020 presidential race the coattail margin was not as determinative as it has been in other such campaigns during the past 20 years.

Though not legal victories in the sense that the first-place finisher did not obtain the office sought, the two Georgia Senate elections did yield Republican “wins,” if you will, since the GOP candidates finished ahead of their Democratic counterparts in a state that President Trump failed to carry.

Remember that all of the Georgia races finished with razor-thin margins, so the pattern is not particularly definable. While President Trump was losing to Biden by just 12,670 votes of 4.998-plus million ballots cast, Sen. David Perdue (R) outpaced Democrat Jon Ossoff with an 88,098-vote spread, and the aggregate special election Senate Republican vote total was 47,808 higher than the combined Democratic sum.

The patterns of how the Senate Republican candidates fared with President Trump leading the ticket are interesting in that they don’t yield a consistent flow. In the 35 Senate races from 34 states where such elections were conducted, President Trump carried 19 of the states hosting Senate races as compared to 15 for Mr. Biden. Simultaneously, Republican candidates placed first in 22 of the 35 Senate races.

In 10 of the states hosting a Senate race where President Trump won, the Republican Senate candidate, though winning in all 10 of those instances, ran behind the top of the ticket by an average of 2.2 percent. Conversely, however, in nine other states that President Trump won, he fell behind the GOP Senate candidate by an average of 2.8 percent.

Turning to the 16 states hosting Senate elections that Joe Biden carried (counting Georgia twice because of their two Senate campaigns), President Trump ran ahead of the losing Republican Senate candidate in nine states by an average percentage factor of 1.9, while he ran behind the losing Republican in four, and then behind the winning — or first-place — Republican in three more. In these latter situations, the deficit margin was 1.8 percent.

Continue reading