Tag Archives: Pres. Barack Obama

Virginia Numbers Tell the Tale

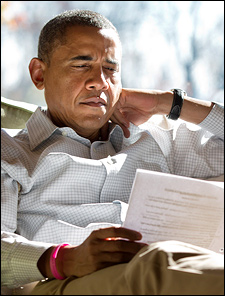
(Official White House Photo by Pete Souza)

The Virginia State Board of Elections just released their 2012 results segmented by congressional district, the first state to do so, and the data give us further insight as to why Pres. Barack Obama again carried the Old Dominion. The state was long known to be one of the determining voting entities of the campaign, therefore the refined and newly released information carries national significance.

Statewide, voter turnout was reported to be 75.9 percent of the registered voters recorded as “active” by the Virginia state elections officials. The highest turnout district was that of House Majority Leader Eric Cantor (R-VA-7), as 82.8 percent of the central Virginia active registered voters participated. The lowest turnout rate was found in Rep. Gerry Connolly’s (D) northern Virginia 11th District where only 68.9 percent of active registered voters went to the polls.

At the congressional level, eight of the 11 districts were drawn to favor Republicans. The map performed as designed, because the eight GOP congressional incumbents all won re-election. In the presidential race, however, Obama obviously outperformed his Democratic congressional running mates, but only carried one more district than they. Obama won Districts 2 (Rep. Scott Rigell-R), 3 (Rep. Bobby Scott-D), 8 (Rep. Jim Moran-D), and 11 (Rep. Connolly). Therefore, despite GOP nominee Mitt Romney carrying seven of 11 congressional districts, he still lost the state. Obama’s official margin over Romney was 149,279 votes, meaning at least this many people are ballot switchers or did not vote in their individual congressional race.

Perhaps the most extraordinary finding is how Romney’s performance compared to the Republican congressional candidates. In all but one CD, the Republican congressional candidate recorded more votes than Romney. The lone exception was the western-most 9th District, commonly called “The Fighting Ninth” or the “coal district.” Here, Romney scored 11,456 votes more than Rep. Morgan Griffith (R), even though the latter was winning a convincing 61.3 percent re-election victory.

But it is the Northern Virginia seats where the most eye-opening results occurred. Despite not running competitive campaigns against Reps. Moran and Connolly, Republican candidates J. Patrick Murray and Chris Perkins in Districts 8 and 11, respectively, actually recorded more votes than did Romney. Murray secured 4,933 more votes than the Republican presidential nominee; Perkins garnered 9,441 tallies greater than Romney’s total. But none can come close to the results found in the new 10th District, where veteran Rep. Frank Wolf (R) out-polled Romney by 38,362 votes.

To put this in perspective, even though Murray received only 30.6 percent support against Moran and Perkins 35.5 percent in opposing Connolly, more people voted for them in these two districts than for Romney.

The other determining region was the Tidewater area, where the former Massachusetts governor failed to carry Rep. Rigell’s District 2 (he scored 48.6 percent there) and ran 12,466 votes behind the congressman, who won his first re-election with 53.7 percent. The other marginal Republican Tidewater CD, Rep. Randy Forbes’ (R) 4th District, showed an even greater difference between Romney and the congressional candidate. Here, Forbes ran 18,287 votes ahead of the man at the top of his party’s ticket. Romney eked out a 50.1 percent win over Obama, while Forbes racked up 56.9 percent in clinching his sixth re-election.

Comparing the presidential and congressional races to the Senate campaign between eventual winner Tim Kaine (D), the state’s former governor, and ex-Sen. George Allen (R), it was the Democratic candidate who carried the majority of the congressional seats — six to the Republican’s five. In addition to the seats that went for Obama (Districts 2, 3, 8 and 11), Kaine also carried Republican districts 4 and 10.

In more Virginia news, Quinnipiac University (Nov. 8-12; 1,469 registered Virginia voters) just released the first public survey of next year’s gubernatorial contest. Not surprisingly, the results determined that popular Sen. Mark Warner (D) would easily defeat both known Republican aspirants, Lt. Gov. Bill Bolling and Attorney General Ken Cuccinelli. Warner’s margins are 53-33 percent over Bolling and a similar 56-33 percent when paired with Cuccinelli. There has been speculation that Warner might enter the state’s 2013 governor’s race, thus giving him a better platform from which to launch a presidential campaign in 2016.

Former Democratic National Committee chairman and 2009 gubernatorial candidate Terry McAuliffe was likewise tested against the two Republicans. These match-ups suggest a much closer statewide race. Against Bolling, McAuliffe jumps out to a slight 38-36 percent lead; the margin becomes 41-37 percent when Cuccinelli is inserted as the hypothetical Republican nominee.

Race Updates; Freshmen Stats

The remaining two California House races are developing clear and similar trends as more ballots are counted and reported. Both Reps. Dan Lungren (R-CA-7) and Brian Bilbray (R-CA-52) are falling considerably behind their Democratic challengers.

In Lungren’s case, physician Ami Bera has now jumped ahead by 3,284 votes in the last publicly released count with approximately 50,000 ballots left to verify and count. Bera’s lead has grown consistently since Election Day, when he led by less than 1,000 votes. In San Diego, Port Commission chairman Scott Peters has increased his lead to 1,899 votes with about 60,000 remaining to count. This race, too, showed less than a 1,000 vote differential on Election Day. The most recent trend is likely to yield two more Democratic congressional victories. If the challengers do go onto win, the new California delegation split will be 38D-15R, a gain of four Democratic seats.

Five Golden State districts can expect to see major competition in 2014, when the lower mid-term turnout could pose more favorable results for Republicans. Newly elected members in the 7th (Bera) and 52nd (Peters) districts, should they ultimately end in a Democratic victory, can expect strong re-election competition, as will freshman in the marginal 26th District (Rep.-Elect Julia Brownley; Ventura County), and the 36th District where Dr. Raul Ruiz defeated Rep. Mary Bono Mack (R). These seats were designed to be competitive for most of the decade. Republican Gary Miller who won the new 31st District after two Republicans surprisingly qualified for the general election can expect a strong Democratic challenger next time.

The new freshmen are beginning to file into Washington for orientation, and more is being learned about them and the electoral patterns that we all just witnessed. In the House, a minimum of 80 new freshmen will be sworn into office in January, more once the five outstanding races are settled. A dozen new senators will also take their seats as the new year begins.

Unlike the past three election cycles, 2012 proved to be an incumbents’ year. Pres. Barack Obama was, of course, re-elected as were all but one US senator (Scott Brown of Massachusetts) who chose to seek another term. In the House, not counting those members who faced their colleagues in paired incumbent situations, 368 sought re-election and a minimum of 344 were victorious. Therefore, the total congressional incumbent retention factor is right around 94%, proving that the electorate is returning to its pro-incumbent predisposition.

Of the 12 new senators, six are current members of the House of Representatives, three are former statewide officials (two governors and an attorney general), two are from the legal and private sector, and one is a state legislator.

Turning to the 80 known House freshmen, nine are former US House members, 29 are current or former state legislators, 21 from the legal and private sector, 14 currently hold or formerly held local office, three are federal officials, two physicians, and a pair of career military officers.

As you can see, these numbers represent quite a change from the previous House where a full 40 members held no previous political office of any kind.

Bono Mack Loses; West in Recount; Other Election Updates

We’re learning more about the eight outstanding House races, and one thing is clear: The trends that so favored the Democrats on Election Day are continuing in political overtime.

Rep. Mary Bono Mack (R-CA-45)

Rep. Mary Bono Mack
Congresswoman Bono Mack who succeeded her late husband in Congress, Rep. Sonny Bono upon his untimely death in early 1998, conceded her re-election contest to physician Raul Ruiz on Saturday in California’s Riverside County/Palm Desert region. The current results, which continue to evolve because California non-Election Day votes are still being counted, put the eight-term congresswoman 7,336 votes behind Ruiz. Such a deficit is too large to overcome considering the number of outstanding votes, hence her decision to concede.

The new 36th District contains 75% of the territory from Ms. Bono Mack’s current 45th District and actually became two points more Republican in redistricting, but this year’s Democratic political tide was too much for her to overcome.

Reps. Dan Lungren & Brian Bilbray
In northern California, at the end of counting on Friday, Rep. Dan Lungren (R-CA-7) had fallen further behind his challenger, physician Ami Bera (D). Trailing by just 184 votes on Election Day, Lungren now faces a 1,779 vote deficit with still more than 70,000 ballots remaining.

In the San Diego area, we find a similar trend. There, San Diego Port Commission chairman and ex-City Councilman Scott Peters has extended his lead over Rep. Brian Bilbray (R-CA-52) to 1,334 votes. Approximately 80,000 ballots remain to be counted. With such large pools of ballots still remaining, anything can still happen in both of these districts, but clearly the first reported non-Election Day counts favor the Democrats in both districts.

Rep. Allen West
Turning to southeast Florida, Rep. Allen West (R-FL-18) is encountering a different problem than awaiting a long ballot counting process, but he appears to be having at least a modicum of success in waging his voting irregularity argument. Virtually all of the ballots have been counted here — only those from the military and overseas remain — and West trails attorney Patrick Murphy (D) by 2,442 votes. The congressman’s claim concerns the tabulation of early votes in St. Lucie County. The original election night count gave West about a 1,700 vote lead. When St. Lucie County election officials decided to recount the early votes, based upon a reported technical glitch, the margin shifted by more than 4,000 votes in Murphy’s favor. On Friday, a local judge ordered the 37,000+ St. Lucie County early votes to be recounted. The crux of the West argument is that some of the early votes were double-counted with those cast on Election Day.

Arizona
Counting continues in two undecided Arizona congressional districts. In the tight 2nd District, Rep. Ron Barber (D), who won his seat in a June special election, for the first time leads former Gulf War veteran Martha McSally (R). When counting ended Friday, Barber had taken a 289-vote lead. There could still be as many as 40,000 ballots to count. In the new 9th District, Democrat Kyrsten Sinema continues to lead Republican Vernon Parker, as she has virtually from the beginning. With tens of thousands of ballots remaining, Sinema’s lead has now increased to a substantial 4,710 votes.

Rep. Mike McIntyre
In North Carolina’s 7th District, the re-count trend has favored Republican David Rouzer in his quest to unseat Rep. Mike McIntyre (D). With the counting process continuing, McIntyre’s lead is now down to 394 votes. The final tally is due to be reported on Nov. 16th. Since it is almost a certainty that the end result will fall within a 1% margin, a full recount will be ordered in compliance with state election law. This result will likely hang in limbo for several more weeks.

Rep. Jim Matheson
Counting also continues in Utah’s close 4th Congressional District race even though Republican challenger Mia Love has already conceded to Rep. Jim Matheson (D-UT-4). The congressman’s margin in 2,646 votes, and an eventual Matheson victory will be the final official result.

Florida
Turning to the one outstanding state in the presidential contest, Florida election officials have declared Pres. Barack Obama the winner of the Sunshine State vote, meaning the final Electoral College margin is 332-206 in the president’s favor.

Washington
The one remaining Governor’s race has also been decided. Former Rep. Jay Inslee (D-WA-1) has been declared the winner of the Washington gubernatorial race, defeating Attorney General Rob McKenna (R) 51-49%.

Predicting the Presidential Outcome

At long last the election is finally here, but we still can’t predict the presidential outcome with any confidence. Recognizing that there have been many conflicting national polling factors present for the past several weeks, now at the end of the campaign it appears that all of the major pollsters are projecting just about the same final national popular vote result – a virtual tie.

Seven polls were released on Thursday through Saturday, and four of them (Ipsos/Reuters, Rasmussen Reports, UPI/C-Voter, and Zogby for the Washington Times) produced a high-40s deadlock between Pres. Barack Obama and Republican challenger Mitt Romney. Two (Purple Strategies and Public Policy Polling) forecast a one-point lead for Obama. One, the ABC/Washington Post poll, showed Romney with that same single-point advantage. Simply put, the national election doesn’t get any closer.

Good news actually exists for both candidates in these final surveys. First, bringing the candidates back into a tie is positive for the president, who had been starting to drop behind. On the other hand, and an argument in Romney’s favor, an incumbent tied going into the election is rarely a good sign, because challengers typically under-poll to at least a small degree.

On the state front, Ohio still appears to be the deciding factor. There are some favorable indications that Romney will win close victories in North Carolina and Florida, which are his top priority conversion states. He also is trending upward in Virginia, but the all-important Buckeye State remains a mystery. The president has a slight edge in several polls, but not in others.

Looking at the secondary states, though Nevada and possibly Iowa look to remain in the president’s column, Romney is getting strong positive signs from Colorado. Should he be successful in taking Virginia and Ohio, Colorado would clinch a victory for the challenger.

Polling

There has been a great deal of analyses done about the myriad of polls conducted over the past months, and the conflicting nature between the ones that have projected the 2012 vote using a turnout model based upon 2008 voting patterns. Many have said that using such base data explains the polling discrepancies because the 2012 electorate is much different than that of four years ago. Therefore, using the 2008 model may skew too heavily Democratic.

Mike Barbera, a Washington lobbyist and guest columnist for our reports, has studied this situation, and offers the following perspective: Given all available evidence, the idea that the 2012 electorate will be as Democratic as 2008 is implausible – and the notion that it will be even more Democratic is to be completely rejected.

The 2008 election cycle featured the following:

  • A highly motivated Democratic base, enthused by the historic candidacy of Barack Obama and still seething with animus toward George W. Bush
  • A dispirited Republican base (although the Palin vice presidential selection remedied this to a certain degree)
  • A historically-unpopular outgoing Republican president
  • A huge funding disparity, which allowed the Obama campaign to dramatically outspend the McCain forces on the airwaves and in the get-out-the-vote (GOTV) efforts
  • An economic meltdown a month before Election Day

That is a recipe for what a great Democratic year looks like – and indeed the Democrats in 2008 had a great year. They elected a president as well as super-majorities in both the House and Senate.

To put it mildly, 2012 looks nothing like 2008. By any measure, Republican enthusiasm is much higher than in 2008. Obama’s favorability ratings are significantly lower than they were in 2008. His job approval ratings are dismal. Romney and his GOP allies are at financial parity with the Obama campaign and the Democrats – so the Republican GOTV efforts are vastly improved from the threadbare McCain operation of 2008. Romney is doing very well among independents – John McCain lost them by a substantial margin.

Early Voting

States are reporting the number of ballots already returned through the various early voting processes. While all of the partisan numbers, i.e. the ballots returned from registered Democrats, Republicans, and unaffiliated voters, are better for Romney and the Republicans than the ratios from four years ago, it is unclear if they are a precursor to a Romney victory performance.

The Romney camp compares the current early voting trends to that of 2008 GOP nominee John McCain and illustrates what they believe is their candidate’s improvement over his showing. While there seems no doubt that the already returned ballots will yield better results for the Republican, as the Obama campaign points out, Romney must exceed the president’s vote total, not just that of McCain, and in every state but Colorado (that releases early voting partisan registration data) more Democratic ballots have been returned than Republican. All totaled, almost 30 million people have already voted in this election.

The Senate

Democratic trends in the statewide contests are better than for Republicans. It now appears likely that the Democrats will retain control of the Senate and do so with about the same level of strength they currently maintain: a seat up or down from the current 53D-47R margin.

The House

While the Senate races appear to be trending Democratic, the Republicans are pulling away in the House. The GOP majority is secure, and their original majority margin, based upon 242 seats, could even increase by as many as three or four seats when analyzing the final individual race trends.

Conclusion

This election is very close, and could be following one of two election models. The first would be that of 1980, where Ronald Reagan was running close to incumbent President Jimmy Carter, only to catch a wave at the very end and go onto a major landslide victory. The second potential precursor is the 2004 election, where a relatively unpopular incumbent President, George W. Bush, won a close victory that basically came down to the state of Ohio becoming the deciding factor. Determining the actual result is now merely hours away.

GOP Senate Momentum Has Stalled

The Indiana Democratic Senate campaign of Rep. Joe Donnelly released its internal Global Strategy Group poll (Oct. 28-30; 600 likely Indiana voters) that posts their man to a 43-36-9 percent advantage over Republican Richard Mourdock. The latter number is going to Libertarian Party candidate Andrew Horning. Mourdock countered by making his internal data public, a poll that claims his deficit is only one point. But even this latter margin is a reduction in support for the reeling Republican as a rape-related abortion comment in the final candidates’ debate could prove to be the deciding factor.

Republican gubernatorial nominee Rep. Mike Pence probably confirms Donnelly’s lead with his latest actions. Though releasing positive numbers for his own campaign and that of the presidential contest, the Pence team remained mum on the Senate race, leading to speculation that their internal data also shows Donnelly leading.

Taking Indiana would be a huge boon to the Democrats and will go a long way toward achieving their goal of holding the Senate majority.

In two western states, however, the GOP trend may be improving.

The National Mining Association, through their continuing Count on Coal campaign, launched an attack against Montana Democratic Sen. Jon Tester. The group goes so far as to say that Tester has joined Pres. Barack Obama’s “war on coal” for not supporting the coalition efforts and for his backing of federal regulations that have largely undermined the state’s coal production operations. Along with the Democratic gubernatorial nominee, Tester has refused to sign onto the Montana coal petition that pledges to protect the industry. Despite being a place of just under one million inhabitants, Montana ranks fifth in the nation in coal production, producing slightly under 45 million tons in its apex year of 2010.

Republican Denny Rehberg signed the pledge, as have most other candidates throughout the state, and the coal group is trying to make this issue the deciding factor of the campaign. In a race that has polled even for months, one coalition group heavily promoting a critical issue position could have a major effect. Energy issues are making an impact in races across the country, especially in the West.

Conflicting polls are now coming from New Mexico. Rep. Martin Heinrich, the Democratic nominee, released his internal GBA Strategy numbers (Oct. 27-29; 600 likely New Mexico voters) that again places him 10 points ahead of former Republican congresswoman Heather Wilson. But, earlier this week, Wilson countered with her own Public Opinion Strategies survey (Oct. 21-22; 500 likely New Mexico voters) that showed her topping Heinrich, 44-43 percent in this case, for the first time in the campaign.

Heinrich’s numbers have held for most of the election cycle, and he has been in stronger position than one would have guessed running against a Republican former representative who proved she could win repeatedly in Democratic regions. If her earlier POS data is correct, it might signal that her campaign could be peaking at the right time and become the Republican sleeper race that many people suggested it might be earlier in the year.

Overall, however, the Democrats look to be in the more favorable position than Republicans in Massachusetts, Virginia, Florida, Ohio, Pennsylvania and Wisconsin. The GOP is likely to convert Nebraska, and is trending more positively in North Dakota. With the likely loss of the Maine seat to Independent Angus King, the Republicans could be trading two of their current seats for two others, but this still leaves them four short of majority status.

If Indiana and Montana cancel each other from a party division perspective, and Elizabeth Warren unseats Republican Sen. Scott Brown in Massachusetts, the Democrats could actually end the night breaking even, or losing fewer than the four seats than the GOP needs to snatch away the majority. Democrats are protecting 23 seats in this cycle as compared to the Republicans’ 10, thus giving the GOP many offensive opportunities. But their early positive momentum has definitely stalled.

Little Change in Two Years

Less than one week before Election Day 2012, we know little more about the projected outcome than we did when the campaigns began in earnest almost two years ago. At that time there was uncertainty about the presidential election. A feeling persisted that Pres. Barack Obama could certainly win re-election, but enough vulnerability existed that a strong challenger could deny him a second term.

With majority Democrats having to protect 23 of the 33 in-cycle contests, control of the Senate appeared up for grabs. With the 2010 state legislative elections swinging hard toward the Republicans, thus giving them clear control of the redistricting process, it became a foregone conclusion that the House GOP majority would be sustained in a post-reapportionment election year with newly drawn congressional district boundaries.

Two years later and six days away from the people’s decision, we still have no counter-arguments to any of these observations.

According to all of the latest national polls, the presidential race is a virtual tie. Seven national pollsters released popular vote surveys yesterday and the biggest spread among the group was Rasmussen Reports producing a two-point lead for Republican Mitt Romney. Five of the polls were showing one-point margins either way, and one, Public Policy Polling for the Service Employees International Union (SEIU), showed a 49-49 percent tie. It simply doesn’t get any closer.

Turning to the states, we find equally close numbers though the Romney position has improved in many key electoral vote havens. Think of the model that stated the Republican needed to convert Indiana, the 2nd Congressional District of Nebraska (because the state awards it electoral votes individually for the candidate carrying each congressional district), Florida, North Carolina, Virginia, Ohio and one other Obama state larger than Vermont or Delaware. Today, Romney looks solid in Indiana and NE-2, and good in Florida and North Carolina, while improving to even footing in Virginia. But this standing, while much better than his Republican predecessor’s of four years ago, does not clinch victory.

The next tier becomes determining. The Romney trends in Ohio are improving, and at least one pollster, Rasmussen Reports, actually has the challenger forging ahead in the Buckeye State by the slimmest of margins. All other survey research firms show either a tie or a slight Obama lead. Trends seem to be moving Romney’s way in Colorado. Iowa, Wisconsin and New Hampshire are all still very much in play, and are virtually deadlocked. Obama has been recently drawing stronger numbers in Nevada. Movement could still occur in Pennsylvania, Michigan, Minnesota and possibly even Oregon, but it is likely that these states are only flirting with the Republicans and will return to the Democratic fold on Election Day.

Though there are still ways for Romney to win nationally without carrying Ohio, assuming the rest of our analysis rings true, he likely won’t unseat the president without winning what is becoming the deciding state. It is very likely that the way Ohio eventually votes will determine who remains or becomes president. Amazingly, the election is still simply too close to call.

The Senate remains just as tight, though Democrats are in good position to hold at least a bare majority. There are still 14 Senate races projected to be within the margin of error, so anything can still happen. The outcome of the presidential race will likely help decide all of these critically important, and virtually dead even contests.

There are ominous signs on the near horizon for the president, however. As an incumbent, going into an election tied rarely leads to victory. The Obama campaign confirms Romney’s momentum by consistently promoting a negative message. Additionally, aggregate estimates from all of the early voting states suggest that the Democrats are more than 20 percent behind their 2008 pace of returning the ballots to the election officials. They are still responding in greater numbers than Republicans, but the Democratic margin is certainly down. And, finally, we are all basing our predictions on polls showing a zero to two-point difference when their own error factor is 2.5 to 3.5 percent.

It’s clear this election will be very close and it’s possible we could be headed to political overtime, meaning absentee ballot counting could again make the difference, just as it did in 2000.

Gallup Shows Likely Voters Skew to Romney

Source: Gallup

The Gallup organization released their likely voter model on Oct. 26, which, along with Rasmussen Reports, has consistently shown much better numbers for Mitt Romney than other national polls. It is important to note that Gallup and Rasmussen are the only two pollsters that have tracked the presidential race every day for the entire election cycle. Both have found consistently similar results, too. The myriad of other pollsters have conducted benchmark or brush fire polls, meaning they are surveying the national electorate for just a short period in time and producing a snapshot of the voters’ intentions rather than a trend.

Right now, all of the polling suggests a Romney lead in the national popular vote among those considering themselves likely to vote, with Pres. Barack Obama doing better in the critical states and among the registered voter universe. The likely voter numbers are producing a very unique and inverted situation because similar situations in the past have always shown the Democratic candidate leading the popular vote, while the Republican fared better in the states.

According to the Gallup analysis, the electorate looks virtually the same as it did in 2008, but the voting intensity model is quite different. There is either no, or only a one-point, difference in the demographic categories when comparing today with four years ago, and as much as a four-point increase among non-white voters when overlaying 2012 data against what was found within the 2004 electorate that re-elected George W. Bush.

Gallup maintains that their likely voter model, culled from a series of seven screening questions (see below), has correctly predicted the final trend in the past two elections. Their 2004 pre-election projection suggested a two-point Bush popular vote win, which is what happened. In 2008, the final data correctly predicted Obama’s win, but over-shot his performance. The Gallup data predicted an 11-point Obama spread; in actuality the final count was +7 points over Republican John McCain.

Today’s model shows virtually no demographic difference between 2008 and 2012, but a major swing in terms of self-identified party registration. Four years ago, 39 percent of the likely voter sample considered themselves Democrats to only 29 percent for Republicans.

According to Gallup’s latest data, the 2012 partisan self-identified likely voter ratio breaks Republican 36-35 percent, a swing of 11 net points for the GOP (+7R; -4D) in comparison to 2008. When the “lean Democrats” and “lean Republicans” are added, the model expands to 49-46 percent Republican (based upon tracking data collected over the Oct. 1-24 period). This is highly significant in detecting electoral intensity. If correct, the 2012 vote will be very different from 2008 and much more Republican. Today, Gallup shows a 50-46 percent spread in Romney’s favor among likely voters. Rasmussen finds Romney’s lead to be a similar 49-47 percent.

But, it all comes down to which of the pollsters’ likely voter model is correct. Gallup has actually posted the seven questions they ask to determine voter participation intent, as reported on Gallup.com.

They are:

  1. Thought given to election (quite a lot, some)
  2. Know where people in neighborhood go to vote (yes)
  3. Voted in election precinct before (yes)
  4. How often vote (always, nearly always)
  5. Plan to vote in 2012 election (yes)
  6. Likelihood of voting on a 10-point scale (7-10)
  7. Voted in last presidential election (yes)

Answers are graded on a scale of 1-7 and the results categorized accordingly. The latest numbers from their registered voter pool gives Obama a 48-47 percent edge, but the likely voter group goes significantly for Romney, as previously mentioned, 50-46 percent.

It’s going to be a very close and interesting election. Next week will determine which of all predictions are correct, but Gallup has already provided the most information to help us understand their support methodology.