Tag Archives: approval rating

A Cuomo Comeback?

By Jim Ellis

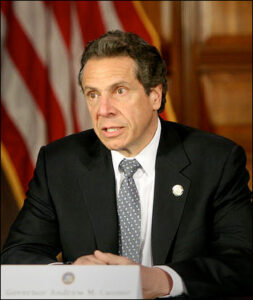
Resigned New York Gov. Andrew Cuomo (D)

March 30, 2022 — Resigned New York Gov. Andrew Cuomo (D) has rather astonishingly not yet ruled out trying to regain his position in this election, and a new Siena College Research Institute poll (March 20-24; 804 registered New York voters, 309 Democratic primary voters) suggests that he might be a competitive contender should he ultimately enter the race.

While it is still unlikely that Cuomo will return, although he has already financed a wave of “rehabilitation” ads designed to improve his damaged image, the Siena numbers do reveal some weaknesses within the Democratic establishment. This means the general election might become interesting.

One of the Siena poll questions asked about Cuomo’s potential status as an independent candidate for the November election. With an eventual Republican nominee, likely US Rep. Lee Zeldin (R-Shirley/East Long Island), presumably being more competitive than a typical New York statewide GOP candidate in this coming general election, a strong independent or minor party contender could become a significant factor in the final outcome and may even have a narrow victory path.

If the resigned governor is to make a move, he is running out of time to file in a partisan primary. Since he is not the endorsed New York Democratic Party candidate, Gov. Kathy Hochul is, he could obtain a ballot position only through submitting 15,000 valid registered voter signatures on or before the April 7 candidate filing deadline. If he were to attempt ballot access as an Independent, that related deadline does not expire until May 31.

While the base Democratic numbers are still strong for President Biden and Gov. Hochul, base Republicans are equivalently fervent against them, but this group is less than half the former’s size. More problematic for the Democratic incumbents and candidates, however, are the non-affiliated voter results, which are clearly trending away.

According to the Siena figures, Gov. Hochul already has an upside-down job approval rating of 42:53 percent within the electorate as a whole, but a positive 63:33 percent ratio among Democrats. She records only a 19:65 percent favorably index from Republicans and a more troubling 31:40 percent negative ratio with the non-affiliated and minor party voter segment.

The most recent published voter registration figures, those dated Feb. 21, 2022 from the New York State Board of Elections, find that 12,982,819 individuals are registered to vote, 49.8 percent of who identify as Democrats. Republicans account for only 21.9 percent of the overall electorate, and added with the 1.2 percent who register in the Conservative party, the clear right-of-center percentage expands to 23.1 percent. Still, this combined figure is less than half of the Democratic number.

Continue reading

Cortez Masto Rebounds in New Poll

By Jim Ellis

Nevada Sen. Catherine Cortez Masto (D)

Feb. 4, 2022 — Nevada Sen. Catherine Cortez Masto (D), who trailed in the most recent published statewide poll (Trafalgar Group; Nov. 24-29; 1,034 likely Nevada general election voters; Adam Laxalt (R) 44 percent, Cortez Masto (D) 41 percent) has rebounded to regain the lead according to a new OH Predictive Insights survey, but warning signs persist for the first-term incumbent.

The OHPI poll commissioned for the Nevada Independent news site (Jan. 19-26; 755 likely Nevada registered voters, online) finds Sen. Cortez Masto topping former state Attorney General Laxalt (R) in a general election ballot test by a 44-35 percent margin. While the spread is relatively strong in her favor, posting a 44 percent support number is low for any incumbent.

For example, the same poll tested Gov. Steve Sisolak, a Democrat, and found his preference figure reaching 52 percent if Clark County Sheriff Joe Lombardo were his Republican opponent, and 54 percent if former US Sen. Dean Heller were to become the Republican gubernatorial nominee. Because OHPI forced preference answers, meaning no recorded undecided responses for the governor’s ballot test, the Sisolak support numbers are high. It is unlikely, however, that a traditional preference question would find him dropping to the senator’s current support level.

The OHPI pollster isolated Sen. Cortez Masto’s most significant problem as her being tied to President Biden’s low approval ratings. According to this study, the president only posts a 41:53 percent favorable to unfavorable job approval index, and 33 percent, which is the poll’s top issue response, said that the economy and jobs are most important to them. Isolating Biden’s score on his handling of the economy, the president’s disapproval rose to 55 percent, darkening the political climate for the senator even further.

Laxalt’s low support number (35 percent) is likely due to him recording only a 76 percent preference factor among Republicans. This is likely due to the fact that challenger Sam Brown, a businessman and disabled Afghan War veteran, is becoming a significant contender for the Republican nomination.

Though the GOP sample segment is low in the OHPI survey – only 230 respondents and well below the 300 that becomes statistically significant in a state the size of Nevada – we still see only 37 percent of the Republican base supporting Laxalt while 14 percent names Brown as their preferred candidate. This means that 49 percent of those Republicans polled say they are undecided about whom to support in the GOP Senate primary. Despite having a short sample, the results suggest that Laxalt still has work to do in securing the nomination.

Another changing element that could affect this race, but in a heretofore unknown way, are the party registration changes occurring throughout 2021. Comparing the partisan breakdown in the state from January of 2021 through December of last year, both the Democrats and Republicans lost patrons. Democratic registration dropped 2.9 percent, while Republicans were down 2.5 percent. This meant that those registering Non-Partisan and “Other” were up substantially.

Continue reading

Contrasting Poll Stories

By Jim Ellis

Oct. 21, 2021 — A pair of Schoen Cooperman Research surveys of the New Jersey and Virginia governors’ races are telling somewhat conflicting internal stories.

First, the Schoen New Jersey poll (Oct. 9-12; 500 certain and likely New Jersey gubernatorial election voters) finds incumbent Gov. Phil Murphy (D) leading challenger Jack Ciattarelli (R), a former state assemblyman and business owner, 50-41 percent. Moving through the poll, however, we see the “always vote in gubernatorial elections” cell segment tell a different story.

Among the “absolutely certain” 2021 voters, the race tightens to a 48-46 percent Murphy lead, and among those who say they “always” vote in gubernatorial elections, the Murphy position slightly improves to 49-45 percent.

Schoen also simultaneously conducted a similar poll of the Virginia governor’s race (Oct. 9-12; 500 certain and likely New Jersey gubernatorial election voters), and the segmented results offer an even more stark contrast when compared with the overall sample.

On the ballot test, former Virginia Gov. Terry McAuliffe (D) leads ex-hedge fund CEO Glenn Youngkin (R) by a 47-43 percent count, numbers and a spread we have seen consistently throughout the Old Dominion polling cycle.

Among the “absolutely certain” voters, however, the two are tied at 47 percent, and within the “always vote in gubernatorial elections” segment, Youngkin actually takes a 49-45 percent lead.

This pattern of the most likely voters performing better for the Republican candidates than the sample as a whole is not particularly unusual for what we have previously seen in these two governors’ races, and especially so for Virginia.

In the Commonwealth, Democratic primary turnout was 34,000 people less in 2021 than in the 2017 initial election, a trend contrary to what we’ve seen throughout the nation in the most recent elections. Furthermore, other polls have suggested that the Republican enthusiasm factor for this upcoming vote is definitively greater than among Democratic voters.

Continue reading

Will Michigan & Wisconsin Voters Determine 2020 Presidential Election?

By Jim Ellis

April 6, 2020 — Polls were just released in both Michigan and Wisconsin, obviously two critically important states that will weigh heavily in determining the final outcome of the next presidential election. While it’s too early to take any general election poll as a true projection of what may happen in November, particularly in light of the current unique situation, the survey did reveal some interesting points.

Progress Michigan’s Lake Effect newsletter: “The governors’ approval ratings pertaining to the [coronavirus] crisis are better than those of the president.”

Public Policy Polling tested the Michigan electorate for the Progress Michigan progressive left organization (March 31-April 1; 1,01 registered Michigan voters) and Marquette Law School just completed their quarterly survey of Wisconsin voters (March 24-29; 81 registered Wisconsin voters). Both made public their results.

We won’t pay too much attention to the ballot tests because it is so far away from the actual vote and the political situation is obviously going to change during the coming months, but the two pollsters found President Trump and former vice president Joe Biden within the margin of error in each state. In both cases, it was Biden who enjoyed a three-point lead.

Within this prism, it is important to recall the 2016 race in which polling badly underestimated Trump’s strength against Hillary Clinton in these two places. According to the 270 To Win organization, which tracked polling throughout that election year, the final averages going into the final weekend found Trump trailing by six points in Michigan and seven in Wisconsin. He won each state by approximately one percentage point, thus proving a large error factor in virtually all of the late polling.

A post-election analysis in which the Pew Research Center and CNN participated, among other firms and media outlets, concluded that a major reason for the flawed projections were the much larger number of Democrats willing to respond to the polling questions than Republicans. Even understanding this was the case at the time, the pollsters’ weighting formulas and algorithms still badly missed the mark throughout the crucial Great Lakes region.

Continue reading

Polarized, or Not?

By Jim Ellis

March 1, 2017 — Much is being made about President Trump’s early job approval ratings. Almost across the board, they are low, and particularly so for a new national chief executive, which has naturally attracted media attention.

In their late February report about political polarization, the Gallup polling organization, which began testing presidential job approval back in the Truman Administration and has regularly continued the practice ever since, argues that polarization among the self-identified Republicans and Democrats is a major obstacle for President Trump to overcome. They further make the point that this is not a new phenomenon, as partisan approval polling detected similar numbers for presidents Barack Obama and George W. Bush.

The Gallup analysis, on and around the Feb. 20 time frame, found President Trump’s job approval rating to be 42 percent. When they looked at the two previous presidents, also hitting 42 percent approval rating at certain points in their own presidencies, Gallup found the level of partisan support and opposition among Democrats and Republicans for the president of their own party was virtually identical.

Continue reading

Obama’s Job Approval: A Cause for Concern

Presidential job approval ratings can fluctuate widely based on a rather wide variety of factors. Among these are the status of the economy, whether the U.S. is at peace or war, the presence of real or suspected scandal, etc.

While President Barack Obama’s administration has been free of any significant scandal, the U.S. is currently engaged in somewhere between two and three wars, and is suffering from a painfully slow-growing economy and a 9.2 percent unemployment rate.

While the President’s approval rating has generally fluctuated in a relatively narrow band that has ranged from the mid-50s to the mid-40s for the last two years, the trend in recent weeks has become troubling for Democrats seeking office in 2012.

Yesterday’s daily Gallup presidential approval tracking poll shows Obama’s job approval rating now slipping to 39 percent. The Gallup poll takes a rolling three-day average of opinions expressed by 1,500 adults nationally. The margin of error in the survey is +/- three percent.

While Obama continues to receive broad support from African-Americans, his approval rating among Hispanics and whites has lingered at record lows in the past two weeks. Gallup noted that Obama’s approval rating among postgraduates and high-income Americans has seen a particularly steep decline since the late May-early June time period, which was the last time his average weekly job approval rating registered at least 50 percent.

At this stage of his presidency, Obama’s standing with Americans doesn’t compare very favorably with other post-WW II presidents. At the 940 days in office mark (Aug 20), here is how Obama compares to the other Presidents, since Harry S. Truman when polling of this type began:

  • Obama                  40%    Standing for re-election in 2012
  • Truman                54%    Re-elected in 1948
  • Eisenhower        71%    Re-elected in 1956
  • Kennedy              62%    Assassinated in 1963
  • Johnson              48%    Did not seek re-election in 1968
  • Nixon                   49%    Re-elected in 1972
  • Ford                      53%    Defeated for election 1976 (polled at 857 days in office)
  • Carter                   32%    Defeated for re-election in 1980
  • Reagan                 43%    Re-elected in 1984
  • Bush, G.H.W.    59%    Defeated for re-election in 1992
  • Clinton                 46%    Re-elected in 1996
  • Bush, G.W.         59%    Re-elected in 2004

Only Jimmy Carter fared worse than President Obama at this point in the term. The average for the 12 presidents after 940 days in office (857 for Ford) is 47.8%. Thus, Obama is almost eight percentage points below average at this point in time.

The low approval numbers do not mean that the President is doomed to lose his re-election campaign. History shows us that Presidents Nixon, Reagan, and Clinton were all below 50% approval but went on to win impressive re-election victories. In fact, historic landslides were even recorded for Nixon and Reagan. Conversely, two Presidents with some of the highest approval ratings, George H.W. and George W. Bush, both registering a strong 59% positive ranking at this commensurate time during their terms in office, did not fare as well in their re-election campaigns. As we know, George H.W. Bush was defeated for a second term, and his son won a close battle against a below average Democratic candidate.

While President Obama can certainly rebound and win a second term in office at the end of next year, the low approval ratings must be a cause for concern in his campaign camp. Watch for the President to make significant moves to improve his standing in the coming weeks.
___________________________________________________
For further detailed insights, to sign up for my daily email updates, or to sign up to track specific issues or industries, please contact me at

PR***@pe*******************.com


.