Category Archives: National Survey

New CNN National Numbers Are Out

By Jim Ellis

March 22, 2019 — The CNN television network released their new national survey of the Democratic presidential contest (conducted by SSRS research company; March 14-17; 1,003 US adults, 456 self-identified Democrats and those Independents who lean to the Democratic Party, 448 self-identified Republicans and those Independents who lean to the Republican Party), and while the ballot test results were consistent with most other polling, some different and interesting questions were asked.

CNN compared this poll to their previous study conducted during the Dec. 6-9 period. The first four finishers remain in relatively the same order, but the percentages have shifted and some significantly.

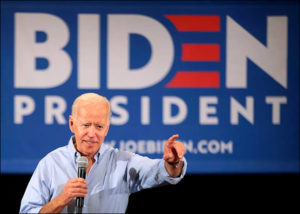
In the current poll, former Vice President Joe Biden continues to lead the pack of 17 tested candidates. He tops the field with 28 percent, down from the 30 percent support he held in December. Sen. Bernie Sanders (I-VT) is second with 20 percent, making a big jump from the 14 percent base CNN found three months earlier.

Sen. Kamala Harris (D-CA) surpasses former US Rep. Beto O’Rourke (D-TX), and tripled her preference from December. Sen. Harris leaps from 4 to 12 percent support. For his part, O’Rourke drops to fourth but still gains two percentage points in comparison to December (rising from 9 to 11 percent). All of the others remain in single-digits, though Sen. Elizabeth Warren (D-MA) doubled her support from 3 to 6 percent.

Continue reading

Fox Poll: A Mixed Bag

By Jim Ellis

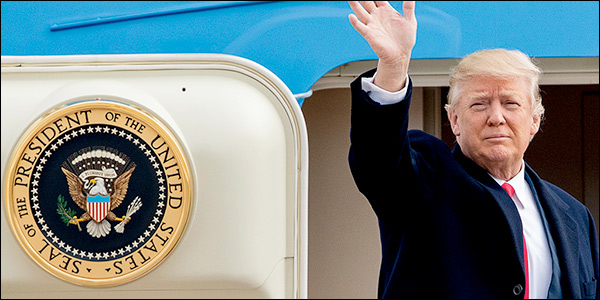
July 21, 2017 — Fox News this week released the results of their regular benchmark poll (Anderson Robbins Research and Shaw & Company Research; July 16-18; 1,020 US registered voters) and find President Trump to be showing some weakness, but not to the degree that the Democrats and media would think and hope.

The polling sample tilts Democratic, and badly under polls Independents. This particular sample features 44 percent Democratic respondents, 37 percent Republican, with just 19 percent self-identifying as politically independent. According to the latest Gallup national party affiliation survey (July 5-9), 28 percent consider themselves Democrats, 25 percent Republican, with 45 percent declaring as Independents.

Overall, the president’s job approval rating is 41:53 percent favorable to unfavorable, which is a little lower than during most of his short tenure in office but still better than the 35:63 percent ratio Trump scored on the Fox pre-election poll (Oct. 10-12; 1,006 US registered voters). Therefore, his favorability index, though seriously upside down, is actually better today than when he won the 2016 election.

While his overall job approval is low, his management of various issue areas is better. In terms of handling the economy, 45 percent approve and 46 percent disapprove. This result represents a slight dip from Fox’s March, April, and June surveys. His best ratio during that time was 48:43 percent (June).

Continue reading

Reuters: Trump Up In
Electoral College

By Jim Ellis

Sept. 20, 2016 — The Reuters/Ipsos “States of the Nation” project finds Donald Trump taking a surprising 243-242 electoral vote lead over Hillary Clinton, but are the individual state projections reliable? Many news sources covered the weekend story, yet it appears that the R/I numbers leave much to be desired. In fact, they show several states going for a candidate either for the first time in this election cycle, or in a manner that other data fails to substantiate.

Reuters/Ipsos is using a huge pool of almost 16,000 respondents, which allows them to segment results for most states. They are also casting several turnout models, and then calculating various Electoral College scenarios based upon the percentage of individual voter groups expected to participate in the November election.

The model forecasting the one-vote Trump advantage features an overall 60 percent turnout ratio among eligible voters, 43 percent for all minority groups, 59 percent African-American participation, and 69 percent from Anglo males. Even with his Electoral College edge, the Reuters/Ipsos results still find Trump trailing Clinton in the national popular vote by a 40-45 percent margin, however.

Questionable conclusions occur in several states. First, addressing the entities where Reuters/Ipsos did not have a large enough respondent sample to determine a trend, several have a clear and decided voting history. Adding Democratic Rhode Island and the District of Columbia’s electoral votes to Clinton’s total would increase her share to 249. For Trump, all other polling data supported by a long vote history would yield both Alaska and Wyoming to him. This would add another six votes to the Republican’s national total, thus leading the adjusted national split to a 249-249 tie.

Continue reading

Trump Trends

By Jim Ellis

Aug. 12, 2016 — Despite major media coverage to the contrary, Donald Trump’s polling standing in comparison to Hillary Clinton appears to be improving nationally, and in certain key states. Other surveys point to Clinton sustaining her large leads.

The latest national poll, from Bloomberg News/Selzer & Company (Aug. 5-8; 1,007 adults, 749 likely US voters) finds Trump pulling back to within four points of Clinton, 44-40 percent, with Libertarian nominee Gary Johnson attracting a nine percent share, and Green Party candidate Jill Stein obtaining a four percent preference vote.

A day earlier, the UPI/C-Voter survey (Aug. 2-8; 993 likely US voters) came out with Clinton also maintaining a four-point advantage over Trump, 49-45 percent. In this survey, the third-party candidates were not included on the ballot test questionnaire.

Twenty-four hours before the UPI poll was released, NBC/Survey Monkey publicized the results of their latest large sample national poll (Aug. 1-7; 11,480 registered US voters). While showing a 10-point, 51-41 percent spread in a head-to-head question, the margin declines to six points (44-38-10-4 percent) when Johnson and Stein are added. The polls including the third party candidates are more realistic because Johnson will appear on the ballot in all 50 states and the District of Columbia, while Stein has so far qualified in 27 states and is awaiting a favorable petition decision in an additional 10.

Continue reading

The Minor Influence

By Jim Ellis

July 7, 2016 — National polling shows a clear change in the presidential race when minor party candidates are included, but will they actually be on the ballot?

A new Suffolk University/USA Today poll (June 26-29; 1,000 US registered voters) finds Hillary Clinton leading Donald Trump 46-40 percent, but the contest changes to a 39-35-8-3 percent split when the two outlying candidates, Libertarian Gary Johnson and Green Party candidate Jill Stein, are added to the ballot test questionnaire. Together, they change the contest, routinely driving both major party candidates below 40 percent.

Former New Mexico governor Johnson looks to be assured of 50-state ballot presence. In 2012, he was also the Libertarian nominee and appeared before 49 state electorates and voters in the District of Columbia. He failed to secure ballot access in only one state, Oklahoma. This year, he expects to qualify on all ballots.

Continue reading

Issues and Attitudes

Dec. 1, 2915 — The results of a new exhaustive national survey were released over the Thanksgiving Day holiday break providing some thought-provoking conclusions.

The YouGov international polling organization in conjunction with London’s The Economist newspaper conducted the major American electorate Internet-based poll (Nov. 19-23; 2,000 adult respondents) containing 100 questions, the answers to which were quickly released and reported upon. (An additional 21 questions were asked according to the analysis, but not included in the report.)

Many of the questions provided an interesting snapshot into how a large segment of the American public is presently thinking. The responses pertaining to candidate ballot tests and individual approval ratings, however, are not of particular significance because the sample contains only 71 percent registered voters. Therefore, they will not be discussed here.

When asked about the one most important issue to each individual respondent, 16 percent said the economy, another 16 percent said terrorism, and 15 percent said Social Security. While a majority (54 percent) do not believe a government shutdown will occur, 31 percent said that Republicans in Congress would be to blame if one were to happen. But, an almost equal 30 percent would attest such responsibility to President Obama. An additional 26 percent said both would be accountable. This is a much different outlook than would be cast from the national media, which would heavily focus upon Republicans as the motivating force to cease operating some government services in order to achieve certain policy objectives.

Continue reading