By Jim Ellis
 Aug. 28, 2020 — A tough battle is underway for the US Senate majority, and both parties are fiercely attempting to assume control in the next Congress. Republicans hold a 53-47 majority, but a win in Alabama would send them to 54-46, and that makes the Democrats’ road to the majority all the more difficult.
Democrats need a net conversion of three Republican seats if Joe Biden is elected president, and four if President Trump wins re-election.
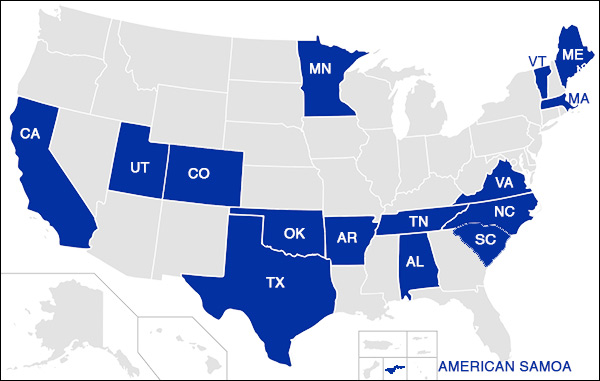
Today, we take a snapshot look at polling figures in the key campaign states. How the states listed below eventually fall will determine which party runs the Senate for the 117th Congress.
Below, we provide you the two most extreme results of recent publicly released surveys from the competitive campaigns. The Ellis Insight ratings depict where the race is today, which is not solely based upon polling.
ALABAMA – Lean R (possible conversion)
Morning Consult (July 24-Aug. 2; 80 likely Alabama voters)
• Tommy Tuberville (R) – 52%
• Sen. Doug Jones (D) – 35%
Auburn University at Montgomery (July 2-9; 55 registered Alabama voters)
• Tommy Tuberville (R) – 44%
• Sen. Doug Jones (D) – 36%
ARIZONA – Lean D (possible conversion)
Redfield & Wilton Strategies (Aug. 16-18; 856 likely Arizona voters)
• Mark Kelly (D) – 53%
• Sen. Martha McSally (R) – 34%
OnMessage (Aug. 2-4; 40 likely Arizona voters)
• Mark Kelly (D) – 48%
• Sen. Martha McSally (R) – 48%
COLORADO – Lean D (possible conversion)
Public Policy Polling (Aug. 18-19; 731 Colorado voters)
• Ex-Gov. John Hickenlooper (D) – 51%
• Sen. Cory Gardner (R) – 42%
Morning Consult (July 17-26; 61 likely Colorado voters)
• Ex-Gov. John Hickenlooper (D) – 48%
• Sen. Cory Gardner (R) – 42%
GEORGIA–A – Lean R/Toss
Garin Hart Yang Research Group (Aug. 10-13; 60 likely Georgia voters)
• Jon Ossoff (D) – 48%
• Sen. David Perdue (R) – 46%
Survey USA (Aug. 6-8; 62 likely Georgia voters)
• Sen. David Perdue (R) – 44%
• Jon Ossoff (D) – 41%


 March 12, 2020 — We have now seen US Senate primaries occur in five states with another six completing the filing process. In 15 instances, we already have either the general election pairings officially or unofficially set, though the Massachusetts Democratic primary on Sept. 1 is effectively the only determinative election.