Tag Archives: President Ronald Reagan

Job Approval: A Poor Indicator

By Jim Ellis — Monday, May 8, 2023

President

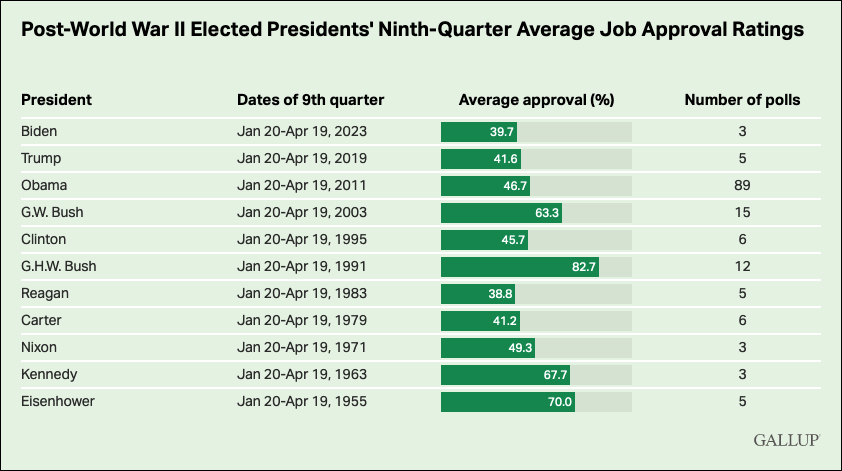
Polling Numbers: The Good, The Bad & The Ugly — The Gallup organization last week released their historical comparison of commensurate modern-era presidential job approval ratings, and it appears that a high positive score is not necessarily a prerequisite for winning re-election; nor is a poor one a precursor for defeat.

Gallup listed the presidents from Joe Biden back through Dwight Eisenhower and captured their mean average job approval ratings from the period between January 20 and April 19 of the year prior to them seeking re-election. Presidents Gerald Ford, John Kennedy, and Lyndon Johnson are not included because they were either not in office during the sampled period (Ford) or did not seek re-election (Kennedy because he was assassinated, while Johnson chose not to run for a second full term).

Looking at the Gallup number for each tested president (the posted figure representing the average polling result for the number of surveys conducted during the aforementioned testing period), President Biden is the worst performer at 38.7 percent favorable; George H.W. Bush, at 82.7 percent, was rated the best.

As you can see solely from that data point, even having the best job performance rating in the early part of the year prior to re-election is no guarantee of winning. While Bush had one of the highest positive ratings on record, he would then post the lowest popular vote percentage (37.5) and the second-lowest electoral vote total (168) of the nine presidents who ran for re-election after 1950.

The reverse is true, as well. The second-worst job approval rating at a commensurate period in his presidency is Ronald Reagan’s 38.8 percent positive score. Reagan would then rebound to the point of recording the strongest re-election electoral vote total (525 of the 538 available votes) in modern political history, and the second-highest popular vote score at 58.8 percent. The only president who outperformed Reagan in terms of a percentage of aggregate votes recorded was Richard Nixon’s 60.7 percent in 1972. Less than two years later, however, Nixon would be forced to resign in disgrace over the Watergate scandal.

Of the nine presidents since 1950 who ran for a second term, six were re-elected (Eisenhower, Nixon, Reagan, Bill Clinton, George W. Bush, and Barack Obama). Three were defeated (Jimmy Carter, George H.W. Bush, and Donald Trump).

In terms of those defeated, Carter’s job approval rating during the tested period was 41.2 percent, Bushes, as cited above, was 82.7 percent, while Trump’s was 46.8 percent.

Interestingly, both Bush’s significantly under-performed in their re-elections. George H.W. Bush dropped 45.2 points from his job approval score in the first quarter of the year before re-election compared to his popular vote total. His son, George W. Bush, was second in this category. While winning a second term with 50.7 percent of the vote, he dropped 12.6 points from his average first quarter 2003 job approval score of 63.3 percent. President Carter came the closest between early job approval, 41.2 percent, and his re-election popular vote total, 41.0 percent. His 49 electoral vote total in 1980, however, was by far the worst among the tested presidents.

Among those 10 presidents, including Biden, the average approval rating is 51.8 percent positive, while the average succeeding popular vote total was 50.3 percent (54.6 percent among the six winning presidents; 41.8 percent among the three losing chief executives).

While it is obviously better to be in a stronger job approval position heading into an election, having an upside-down ratio is not always disastrous. Conversely, as we’ve seen from the Bushes, posting high approval ratings the year prior to re-election is also no guarantee of success at the ballot box.

The fact that President Biden is on the low end of the approval rating index at this point in his presidency is not necessarily a cause for panic for Democrats, nor is it an ironclad prediction factor that he will lose the 2024 election. It is an indication, however, that he will have to pick up the pace of creating a better image and improving his perceived success rate regarding the handling of key issues.

Alabama Map Ruling Stayed; Redistricting Update

By Jim Ellis

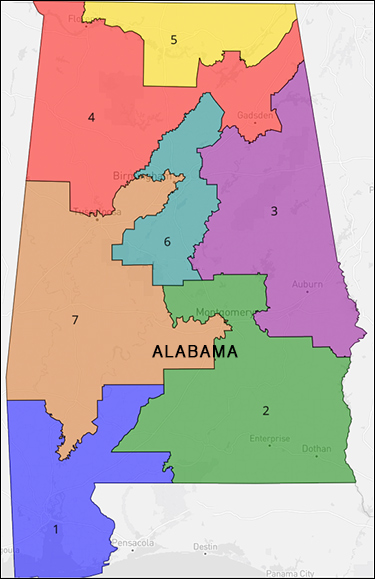
Alabama redistricting map (Click on the map above or go to DavesRedistricting.org to see interactive map)

Feb. 9, 2022 — On a 5-4 vote, the US Supreme Court voted to stay the lower court ruling that invalidated the new Alabama congressional map. A Republican three-judge panel had ruled that a second majority minority district could have been drawn among the state’s seven congressional districts, and thus disqualified the plan on Jan. 23.

Writing a concurring opinion, Justice Brett Kavanaugh stated that the lower court decision was made too close to the 2022 election, meaning that the judicial process would not have proper time to hear the appeal and make an educated ruling prior to the state’s scheduled primary election. The ruling does not mean the appeal was granted, but merely postpones hearing the case to a later date.

Analysts say the stay ensures that the original map will be in place for this year’s election. It does not mean, however, that the map won’t be altered for the 2024 election and beyond.

The new plan is virtually an extension of the current map, which elected six Republicans and one Democrat in the 2020 election. It was a curious original decision, not only because the judges that ruled against the GOP map drawers were appointed by former President Donald Trump (2) and the late President Ronald Reagan (1), but that the same map footprint stood unencumbered for the past 10 years.

The major change made from the current map to the new draw came in the 7th CD, which is the Voting Rights district. The legislature, however, had no choice but to make a substantial change. AL-7 was 53,143 people short of reaching the state’s congressional district population quota of 717,754 individuals.

The previous ruling also postponed the Jan. 28 candidate filing deadline for the Alabama US House candidates. Those running for all other offices have now already filed and been qualified for the respective party primary ballots. The congressional candidates will now file on Feb. 11.

Redistricting Notes

• Summarizing the legal action in other states, the North Carolina map has been disqualified and the legislature will now return to redraw the congressional and state legislative maps. As has been the case throughout the previous decade, the partisan Republican legislature and the partisan Democratic state Supreme Court continue to go back and forth over the issue of partisan gerrymandering.

• The lower court ruling in Michigan rejected the Detroit area Democratic current and former state legislators’ claim that the Michigan Independent Citizens Redistricting Commission members violated the Voting Rights Act in drawing the city of Detroit’s congressional and state legislative maps. Unless an appeal is granted, the new Michigan maps will stand for this year’s elections.

• The Kansas legislature adjourned without voting to override Gov. Laura Kelly’s (D) veto of the state’s congressional map. The hasty adjournment move, however, allows the legislature to reconsider the veto override. Without a successful override vote, the map will go to the courts for a redrawing of the Kansas City metro area.

Continue reading

The First Midterm: A Deeper Story

By Jim Ellis

July 18, 2017 — Much has been made about a new president’s party failing in the midterm directly after his initial national election, but the statistics aren’t quite what they seem. In the House, the average loss for the new president’s party is 26 seats in first midterm during the modern political era, in addition to dropping two Senate seats. But these numbers are misleading.

Many media stories portray the Democrats on the brink of wresting the House majority away from Republicans, and one factor supporting such a claim is the first midterm historical trend. The stories underscore that the Democrats need a net gain of 24 seats to depose the Republicans, two seats less than the average “out party” gain in similar elections.

The research stops short, however, and omits a very key point. Since President Harry S. Truman assumed office in 1945 and stood for election in his own right in 1948, 11 presidents, inclusive, have seen his party lose House seats in first midterm election. President Gerald Ford, because he was never elected to the office, is not included for purposes of this statistical exercise.

Continue reading