Tag Archives: Georgia

The Latest Numbers

By Jim Ellis

Oct. 23, 2020 — Polls are being updated daily in the competitive Senate races. Below are the most recent two surveys from each major contest. Some states provide disparate results, others more consistent. The data source is FiveThirtyEight Polls.


ALABAMA

Moore Information (OCT. 11-15; 504 likely Alabama voters, live interview)
• Tommy Tuberville (R) – 55%
• Sen. Doug Jones (D) – 40%

FM3 Research (Oct. 11-14; 801 likely Alabama voters; live interview)
• Sen. Doug Jones (D) – 48%
• Tommy Tuberville (R) – 47%


ALASKA

Public Policy Polling (Oct. 19-20; 800 Alaska voters, interactive response system)
• Sen. Dan Sullivan (R) – 44%
• Al Gross (D/I) – 41%

Siena College/NYT (Oct. 9-14; 423 likely Alaska voters, live interview)
• Sen. Dan Sullivan (R) – 45%
• Al Gross (D/I) – 37%


ARIZONA

Ipsos/Reuters (Oct. 14-21; 658 likely Arizona voters, online)
• Mark Kelly (D) – 51%
• Sen. Martha McSally (R) – 43%

Rasmussen Reports/Pulse Opinion (Oct. 18-19; 800 likely Arizona voters, automated)
• Mark Kelly (D) – 48%
• Sen. Martha McSally (R) – 44%
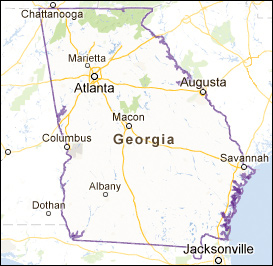

GEORGIA-A

Emerson College (Oct. 17-19; 506 likely Georgia voters; interactive voice response)
• Sen. David Perdue (R) – 46%
• Jon Ossoff (D) – 45%

Garin Hart Yang Research (Oct. 11-14; 600 likely Georgia voters; live interview)
• Jon Ossoff (D) – 48%
• Sen. David Perdue (R) – 43%


GEORGIA-B – Special Election

Siena College/NYT (Oct. 13-19; 759 likely Georgia voters, live interview)
Jungle Primary; top two advance to Jan 5 runoff
• Raphael Warnock (D) – 32%
• Sen. Kelly Loeffler (R) – 23%
• Rep. Doug Collins (R) – 17%
• Matt Lieberman (D) – 7%
• Ed Tarver (D) – 2%

Emerson College (Oct. 17-19; 506 likely Georgia voters, interactive voice response)
• Raphael Warnock (D) – 27%
• Rep. Doug Collins (R) – 27%
• Sen. Kelly Loeffler (R) – 20%
• Matt Lieberman (D) – 12%
• Ed Tarver (D) – 2%


Continue reading

Rep. Collins Makes His Move in
Georgia’s Special Senate Race

By Jim Ellis

Georgia Rep. Doug Collins (R-Gainesville)

Oct. 21, 2020 — Georgia Rep. Doug Collins (R-Gainesville) began the 2020 special Senate election campaign as the early leader, enjoying an advantage over appointed Sen. Kelly Loeffler (R), Atlanta businessman Matt Lieberman, the son of former Connecticut US senator and 2000 Democratic vice presidential nominee Joe Lieberman, and Baptist pastor Raphael Warnock (D), who now ministers the Ebenezer Baptist Church in Atlanta where Dr. Martin Luther King, Jr. and his father once pastored.

The race, however, has changed significantly since those early days.

Georgia Sen. Kelly Loeffler (R)

By taking advantage of her huge personal wealth and being cleared of wrongdoing over controversial stock transactions that she and her husband, Jeffrey Sprecher, the chairman of the New York Stock Exchange, made just after she received early COVID senatorial briefings, Loeffler eventually moved past Rep. Collins in the political standings.

Once Democrats began to coalesce around Rev. Warnock, the race again changed. The pastor began securing first place in multiple statewide polls after receiving many key national endorsements. This left Rep. Collins and Sen. Loeffler, the two Republicans, fighting each other for second place.

Baptist pastor Raphael Warnock (D)

The congressman, knowing he couldn’t compete with Sen. Loeffler’s wealth, or even the Democrats institutional money once the party establishment began to support Rev. Warnock in earnest, held a large portion of his resources for a strong late finish after raising $6 million for the race through Sept. 30.

Rep. Collins’ campaign strategy may be paying dividends. A new Emerson College survey (Oct. 17-19; 506 likely Georgia voters, interactive voice response system and online responses) finds another change in this rather uneven special election campaign. According to their data, Rep. Collins has now tied Rev. Warnock for first place in the jungle primary with 27 percent apiece. Sen. Loeffler trails with 20 percent and Lieberman, who had dropped well into single digits in many other polls, also rebounded to 12 percent support.

This poll conflicts somewhat with a recent Survey USA study (Oct. 8-12; 677 likely Georgia voters, online) that found Rev. Warnock at 30 percent, Sen. Loeffler posting 26 percent, Rep. Collins attracting 20 percent support, and Lieberman back in single digits with eight percent preference. Previous polls returned similar numbers to that of S-USA, but with larger percentages for Rev. Warnock.

Continue reading

Michigan Reverses Direction
On Mail-In Ballot Oversight

By Jim Ellis

Oct. 20, 2020 — The Michigan Court of Appeals on Friday reversed a lower court ruling that allowed a post-election ballot reception period that would have lasted until Nov. 17, and granted the process known as “ballot harvesting,” where another individual or individuals can deliver unspecified numbers of ballots for voters.

The three-judge high court unanimously overturned a ruling from Court of Claims Judge Cynthia Stephens who made the original directive in deciding an election lawsuit that the Michigan Alliance for Retired Americans, a union-funded organization, brought forth.

When the Michigan attorney general and secretary of state jointly decided not to appeal Judge Stephens’ ruling, the Republican controlled state House and Senate filed the motion and were granted standing. It is unclear now whether the Michigan Alliance will appeal to the state Supreme Court.

According to the Detroit News’s reporting, the original ruling contained the directive that the ballots must be postmarked by Nov. 3. That clerical distinction, however, will be difficult to enforce once we advance into the post-election counting and challenge stage.

The US Postal Service, themselves, according to their employee practices handbook, indicate that many mail pieces do not require postmarks. In most of the 21 states that are now allowing the post-election reception period, the ballots will fall into one of these categories thus making the postmark question moot, and that will invariably lead to further lawsuits and litigation. Below is the official language for the postmark directives:

“Postmarks are not required for mailings bearing a permit, meter, or precanceled stamp for postage, nor to pieces with an indicia applied by various postage evidencing systems.”

The Appellate Court ruling means, at least until if and when the state Supreme Court addresses the issue, that there will be no post-election ballot reception period in Michigan. Ballot harvesting pertaining to individuals who are not immediate family members of the person wanting to vote absentee or is not an election office clerk, will again be prohibited. Therefore, all ballots are required to be in the possession of election authorities throughout Michigan’s counties before the polls close on Election Day, Nov. 3.

Continue reading

Georgia Polling Dichotomy

By Jim Ellis

Oct. 16, 2020 — An October polling plethora has been released in Georgia, which is becoming one of the most important 2020 election cycle states both in terms of the presidential and US Senate outcomes. As the only state featuring two US Senate races, Georgia has attracted more than its share of polling universe attention.

Quinnipiac University released new data yesterday that either is detecting a new trend or is an outlier. Their results give Democratic presidential nominee Joe Biden, and US Senate candidates Jon Ossoff and Raphael Warnock big leads in their respective races, something no other survey research firm is reporting.

The Quinnipiac poll (Oct. 8-12; 1,040 likely Georgia voters, live interview) finds Biden posting a 51-44 percent lead over President Trump, Ossoff claiming a similar 51-45 percent advantage over Sen. David Perdue (R), and Rev. Warnock outpacing both Rep. Doug Collins (R-Gainesville) and appointed Sen. Kelly Loeffler (R) by 19 and 21 percentage points (41-22-20 percent).

Six other pollsters, also surveying in October, largely see things much differently.

Polling within the same period as Quinnipiac are Survey USA, Data for Progress, and Morning Consult.

Survey USA chose exactly the same sampling period as Quinnipiac, Oct. 8-12. With a sample size of 877 likely Georgia voters also in live interviews, they see a dissimilar political landscape. While they find Biden leading in the presidential race, his margin is only two points, 48-46 percent.

The two pollsters’ Senate numbers are starkly different. S-USA finds Sen. Perdue leading Ossoff, 46-43 percent, a net nine-point variance when directly compared with Quinnipiac. The jungle primary special election race is even more disparate. While Quinnipiac projects one of the biggest leads for Warnock during the entire election cycle, S-USA finds only a four-point difference between he and Sen. Loeffler, 30-26 percent, a far cry from the Q-Poll’s 41-20 percent.

The two pollsters even see a different ballot test order. While the Q-Poll finds a Warnock-Collins-Loeffler split, Survey USA projects a virtual three-way battle among Warnock, Loeffler, and Collins. The latter poll posts Rep. Collins’ statewide support at 20 percent.

Continue reading

Where the Senate Stands

By Jim Ellis

Oct. 13, 2020 — Now, less than a month before the official Election Day, we see multiple polls coming regularly in almost every competitive Senate race. Democrats need a net conversion of three Republican seats if Joe Biden is elected president and four seats if he is not. With 16 races now on the competitive board, we look at where they each stand. At least two surveys are included for each race.

Looking at the current trends, we see a tightening Senate from the current 53R-47D majority. Under the current swing, Democrats could reach 51, but with several races remaining as toss-ups or in range where they still could go either way. It’s conceivable, at this point, that both parties could claim 49 seats with a fight for the remaining two that would decide the next majority.

All of the polling data is from late September and early October:


ALABAMA: Sen. Doug Jones (D) vs. Tommy Tuberville (R)
• Trend: Tuberville

POLLS:
• University of Auburn @ Montgomery (Sept. 30-Oct. 3; 1,072 registered Alabama voters)
  Tommy Tuberville (R) – 54%
  Sen. Doug Jones (D) – 42%

• Morning Consult (Sept. 11-20; 658 likely Alabama voters)
  Tommy Tuberville (R) – 52%
  Sen. Doug Jones (D) – 34%


ALASKA: Sen. Dan Sullivan (R) vs. Dr. Al Gross (I/D)
• Trend: Slightly Sullivan

POLLS:
• Alaska Survey Research (Sept. 25-Oct. 4; 676 likely Alaska voters)
  Sen. Dan Sullivan (R) – 48%
  Al Gross (I/D) – 44%

• Harstad Strategic Research (Sept. 20-23; 602 likely Alaska voters)
  Sen. Dan Sullivan (R) – 46%
  Al Gross (I/D) – 45%


ARIZONA: Appointed Sen. Martha McSally (R) vs. Mark Kelly (D)
• Trend: Kelly

POLLS:
• Latino Decisions (Sept. 28-Oct. 6; 600 likely Arizona voters)
  Mark Kelly (D) – 47%
  Sen. Martha McSally (R) – 42%

• Ipsos (Oct. 3-5; 550 likely Arizona voters)
  Mark Kelly (D) – 48%
  Sen. Martha McSally (R) – 44%

• Data Orbital (Oct. 3-5; 550 likely Arizona voters)
  Mark Kelly (D) – 49%
  Sen. Martha McSally (R) – 44%

• HighGround, Inc. (Sept. 28-Oct. 5; 400 likely Arizona voters)
  Mark Kelly (D) – 50%
  Sen. Martha McSally (R) – 44%


Continue reading

Senate: A Polling Comparison

By Jim Ellis

Sept. 24, 2020 — Today, we look at the competitive Senate races and segment the group around polling consistency. Several races routinely report point spreads between the two major party candidates that are wildly inconsistent, while others vary over a small difference often within the same polling period.

The two most extreme surveys during the month are listed for each state with the most extreme first and the closest second. You will notice that the British firm, Redfield & Wilton Strategies, is often listed as the most extreme.

We begin, alphabetically by state, with the inconsistent group. Only the two Georgia races are in the September consistent segment.


INCONSISTENT


Arizona
Number of September polls: 14
Polling range: 16 points

Redfield & Wilton Strategies
(Sept. 12-16; 855 likely Arizona voters; combination online and live interview)
• Mark Kelly (D) – 52%
• Sen. Martha McSally (R) – 35%

ABC News/Washington Post
(Sept. 15-20; 579 AZ likely voters; live interview)
• Mark Kelly (D) – 49%
• Sen. Martha McSally (R) – 48%


Iowa
Number of September polls: 2
Polling range: 8 points

Fabrizio Ward/Hart Research (for AARP)
(Aug. 30-Sept. 5; 800 likely Iowa voters; live interview)
• Sen. Joni Ernst (R) – 50%
• Theresa Greenfield (D) – 45%

Selzer & Company
(Sept. 14-17; 658 likely Iowa voters; live interview)
• Sen. Joni Ernst (R) – 45%
• Theresa Greenfield (D) – 42%


Continue reading

Why Arizona is So Pivotal

By Jim Ellis

Does Arizona hold the key in a Trump-Biden election?

Sept. 16, 2020 — For several reasons, the Grand Canyon State of Arizona is possibly the most important state on the political map to determine the ultimate presidential election outcome.

Primarily, Arizona is one of five core states that President Trump must win to form a foundation for a favorable remaining state coalition map. The other four, geographically from west to east, are Texas, Georgia, Florida, and North Carolina. Should Joe Biden break through in any one of these five states, he will likely win the national election.

At this point, Arizona appears to be the most precarious of the Trump core states. While the President’s numbers are improving here, the September polls find him trailing Biden in all six publicly released surveys from a range of one to nine points among likely voters, with a mean average of Biden plus-4, and a median of Biden plus-3.5.

The five states are so critical to President Trump, or any Republican national candidate, because, as a unit, they yield a relatively easy remaining victory map. Carrying the five southern sector domains and assuming no leakage in Ohio or Iowa, and even while not winning Nevada or New Hampshire, the GOP nominee then claims the presidency with a victory in any one of the key Great Lakes states: Michigan, Minnesota, Pennsylvania, or Wisconsin. For a Democrat to win under this scenario, he or she would be forced to sweep the aforementioned quartet.

President Trump won the 2016 Electoral College vote 306-232, which means he can relinquish a net 36 electoral votes in 2020 and still win the national election. Under the scenario of him taking either Wisconsin or Minnesota, along with keeping Arizona, he would defeat Biden with exactly 270 electoral votes. This model also assumes he wins the 2nd Congressional District from both Nebraska and Maine, the two states that split their electoral votes. He won both in 2016. Under this scenario, Michigan and Pennsylvania would go to Biden.

Arizona, now potentially teetering toward the Democrats, is critical to the president’s prospects because Trump cannot afford to trade it for one of the western Great Lakes States, either Minnesota or Wisconsin. Such a loss would force the president to win two of the four Great Lakes, but only one could be Minnesota or Wisconsin since those two states have 10 electoral votes and Arizona has 11.

Therefore, simply put, losing Arizona because of its 11th electoral vote would mean that Trump would be forced to carry either Michigan or Pennsylvania in addition to one of the other three remaining Great Lakes States. A further scenario involving Trump losing Arizona and replacing it with both of the 10-electoral vote states (MN and WI) could result in the election ending in a 269-269 tie. This would force a tiebreaker to be decided in the US House of Representatives.

Let’s look at the chances of Trump winning Arizona by comparing his current standing to where he was at this point in 2016. Looking at the Real Clear Politics polling archives, we find that 19 Arizona polls were conducted during the entire 2016 election cycle. In 2020, just since the July 4th holiday break, 25 surveys were publicly reported in the Grand Canyon State.

Four years ago, at the end of August through mid-September, two individual polls came from Gravis Marketing (Aug. 25-27, 2016) and NBC News/Marist College (Sept. 6-8, 2016). These surveys yielded Trump four and one-point leads, respectively. Shortly thereafter, the trend began to turn Hillary Clinton’s way. The OH Predictive Insights survey (Sept. 28-30, 2016) found the two candidates tied at 42 percent apiece, while Emerson College (Oct. 2-4, 2016) and the Arizona Republic newspaper poll (Oct. 10-15, 2016) detected consecutive leads for Clinton of two and five points.

Therefore, Arizona did not turn toward Trump for good until the Monmouth University survey in late October (Oct. 21-24, 2016), which put him just one point ahead. Going into the election from that point, and remembering the 2016 election was on Nov. 8, Trump led in the final four polls from a two to five-point margin. He would eventually win the actual vote count by 3.6 percentage points, 48.7 – 45.1 percent, meaning a raw vote margin of 91,234 votes of more than 2.573 million ballots cast.

Because of Arizona’s fast population growth, the state has changed in four years. During that interval, the overall population expanded five percentage points to 7,278,717 individuals according to the Census Bureau’s July 2019 estimate, the latest available.

Minorities, specifically Hispanics and blacks, account for approximately 69 percent of the population gain, thus at least partially explaining Biden’s improved prospects in the state. Overall, Hispanics represent 31.7 percent of the overall Arizona population, and blacks 5.2 percent, as compared to the non-Hispanic white position receding to 54.1 percent.

The population changes suggest that this already tight political state will likely become even closer as we head for Nov. 3.