Monthly Archives: July 2021

House Vulnerables – Part I

By Jim Ellis

July 12, 2021 — Much of the early 2022 election cycle narrative places the Republicans in an advantageous position to re-claim the US House majority they lost in 2018, but there are mitigating factors that make predicting such an outcome premature.

To begin, analysts cite the historical voting pattern that yields large midterm losses for the party that wins the White House in the previous election – a mean average House seat loss of 25 for the president’s party in the first midterm in the 11 such elections from Eisenhower in 1954 to Trump in 2018 – which is a key influence factor for the 2022 election cycle.

Since we are immediately following a new census, redistricting will change at least to a small degree all of the districts in the 44 states that will have more than one seat. Most analysts believe Republicans will be at least slight beneficiaries of the new maps because their party controls most of the state legislatures that will draw the new lines.

The states, however, do not yet even have their census tract data and won’t until mid-August at the earliest; therefore, redistricting will be later and even more chaotic than we are accustomed to seeing. The delays could lead to more interim court maps being placed for the 2022 election, which could neutralize any gain the GOP achieves from their favorable position in the majority of state legislatures that have redistricting power.

Additionally, one must look at the 2020 race results to determine which of the seats will become major targets. In November, 53 current House members won their elections with less than 52 percent of the vote, 27 Democrats and 26 Republicans. In terms of the closest election results, and likely meaning the most vulnerable conversion targets for the 2022 re-election cycle, we see 11 Republicans in the 12 seats where the incumbent’s party averaged 50 percent of the vote or below in the previous two electoral contests.

This tells us that the national Republican strength factor heading into the midterm vote may be somewhat weaker than noted in a cursory overview.

Continue reading

NYC Ranked Voting – Any Difference?

NYC Democracy produced a voter palm card to help guide voters in a ranked-choice voting scenario.

By Jim Ellis

July 9, 2021 — The Ranked Choice Voting system was on major display in the New York City primary races that began with early voting on June 12 and ended yesterday with declaration of winners. Adding early voting and Ranked Choice Voting in lieu of traditional ballot casting created a 26-day election period, but did the expanded voting cycle change any results?

Ranked Choice Voting is a variation of an instant runoff, a concept that dates back to a similar system first used in Australia in 1918. The idea is to prevent a person from winning a plurality election with a just a small percentage, i.e., Brooklyn Borough president Eric Adams would have won the New York City mayoral Democratic primary with 30.8 percent of the vote on the single election day of June 22 had the traditional system been in place. This means that 69.2 percent of voters chose another candidate.

Instead, after the 26-day election period, Adams still won the party nomination under Ranked Choice Voting but with a convoluted 50.5 percent majority vote at the conclusion of a marathon counting process.

For years, mostly southern states have used a runoff system to correct the problem of a candidate winning an election with a small percentage, such as NYC’s Adams’ 30.8 percent recorded on June 22. In those places, a secondary election is held between the top two finishers at a later date. Ranked Choice Voting allegedly produces a majority result, but without the expense of running a second election.

Continue reading

Pew’s Post-Election Findings

By Jim Ellis

The candidates in action at the first presidential debate in Cleveland, Ohio: President Donald Trump (left) and former vice president Joe Biden.

July 8, 2021 — The Pew Research Center conducted a post-election poll and spent seven months developing their conclusions. On the last day of June, they publicized their report.

The study, conducted just after the November election (Nov. 7-12; 11,818 individuals through groups of screened panelists, online) was exhaustive.

Quoting the methodology description, “noncitizens and those who refused the citizenship question (N=450), voters who refused to answer the vote choice question (N=84) and panelists who declined to provide their names and thus could not be matched to a voter record (N=139) were removed, leaving 11,145 panelists for analysis.” Of this latter number, 9,668 respondents were validated as voters, meaning the research team verified with a local election office that the particular individual had in fact voted.

The basic voter segmentation conclusions were speculated upon in most media sectors during the early post-election period, but this research validates and expands upon the discovered patterns. Largely, President Biden received a significant boost from suburban voters, which proved the major difference in his increasing Democratic popular vote performance.

Despite losing the popular vote by a substantial margin, former President Trump surprisingly improved his standing with several groups such as Hispanics, Asians, black men, young voters, and women, but not to the degree necessary to counter Biden’s strength with suburban voters.

For example, among suburban voters, according to the Pew research, Biden recorded 54 percent support as compared to Hillary Clinton’s 45 percent in the 2016 election. Conversely, Trump only carried white voters 51-47 percent in the most current election, a major reduction from the 54-38 percent spread he posted four years earlier.

While Trump declined in the suburbs, his performance among rural voters was even stronger than his 2016 benchmark. In 2020, Trump’s percentage among rural voters rose to 65 percent from his 59 percent previous showing. Additionally, rural female voters largely account for his overall increase among women as he moved from 39 percent in ’16 to 44 percent in 2020.

Continue reading

California’s Lost Seat

By Jim Ellis

July 7, 2021 — For the first time in history, California loses a congressional seat in reapportionment, and the public input session that was scheduled to begin yesterday continues the California Citizens Redistricting Commission’s Phase 2 process. This week, the commission members continue listening to testimony about how the districts should be drawn for the state’s congressional delegation and both houses of the Golden State’s legislature.

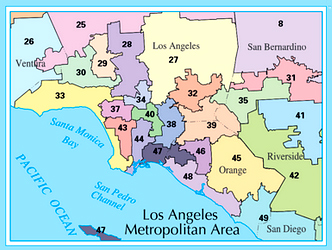
Sitting adjacent to each other are the following California congressional seats: CA-32 (Rep. Grace Napolitano; D-Norwalk), CA-38 (Rep. Linda Sanchez; D-Whittier), CA-40 (Rep. Lucille Roybal-Allard; D-Downey), and CA-44 (Rep. Nanette Diaz-Barragan; D-San Pedro).

After California, along with the other 49 states, receives its census tract information after the Aug. 15 negotiated deadline, the five Democrats, five Republicans, and four non-affiliated CCRC members will study and organize the data until their Phase 3 line drawing process commences in September. The commission was created through a 2010 ballot proposition that removed redistricting power from the legislature and instituted a citizens panel to create the new post-census maps every 10 years. This is the body’s second redistricting cycle.

The commission timeline was crafted after the state of Ohio sued the Census Bureau to force a faster distribution of the state redistricting data. Originally, using COVID as their principal excuse, the Bureau leadership set Oct. 1 as their distribution deadline goal. In typical years, states would have received the census tract information months ago. The Ohio lawsuit was settled with the two sides agreeing on an Aug. 15 deadline that is now in effect for the whole country.

The commission members are now tasked with changing the state’s 53-member congressional delegation into a map that features only 52 seats. And now, the question of just which area will lose the district must be tackled.

Looking at the latest public district data, that through July 1, 2019, we see some patterns providing key clues. It is understood that the last year of the census is not included in these numbers, and reports suggest that the final 12 months of the 10-year cycle resulted in significant change for the state as the number of people leaving for other places substantially increased. In fact, for the first time, California actually has fewer people than it did in a preceding year.

The most significant loss appears to come in central Los Angeles County. Looking at the current 53 districts, the seat with the lowest population is Rep. Adam’s Schiff’s (D-Burbank) San Fernando Valley 28th CD. But the cluster of seats in the heart of Los Angeles suggests an area where two seats can easily be collapsed.

Continue reading

SCOTUS Rules; Calif. Recall Scheduled

Current US Supreme Court

By Jim Ellis

July 6, 2021 — On their last day of the year’s early session last week, a Thursday, the Supreme Court of the United States issued rulings on the Arizona voting rights case and the California non-profit organization disclosure lawsuit.

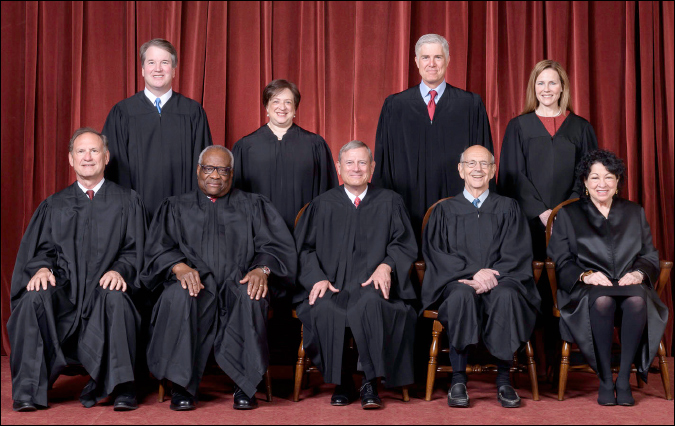
In the Democratic National Committee v. Brnovich, the Supreme Court with Justice Samuel Alito writing for the 6-3 majority, ruled that the state of Arizona did not infringe upon minority voting rights or violate Section 2 of the Voting Rights Act in both prohibiting ballot harvesting with certain exceptions, and not counting provisional ballots cast from voters who do not reside in the particular precinct that the polling place covers.

The high court agreed with Arizona Attorney General Mark Brnovich’s (R) arguments that the laws are not racially motivated, nor do they intentionally discriminate against certain segments of the voting population, thus overturning the full 9th Circuit Court of Appeals ruling.

Originally in 2016, Brnovich won at the district court level and on the first appeal to a three-judge panel from the 9th Circuit. The DNC requested an en banc review of the original appellate ruling that agreed with Brnovich, and the entire 9th Circuit membership overturned the decision, siding with the plaintiff. At that point, AG Brnovich petitioned the Supreme Court, which agreed to hear the case. (Hearing cases en banc allows the full circuit court to overturn a decision reached by a three–judge panel. Due to the decreasing probability of U.S. Supreme Court intervention, the circuit court is often the court of last resort in the ordinary life of a case, thereby amplifying the importance of en banc review.)

In his ruling, Justice Alito stated that “every voting rule imposes a burden of some sort,” and that “mere inconvenience cannot be enough to demonstrate a violation of Section 2.” He also cautioned that, “what are at bottom very small differences should not be artificially magnified.”

While agreeing that holding free and open elections is a “valid and important state interest,” he also addressed the voter fraud argument, clearly stating that attempting to prevent such abuses is also a “strong and entirely legitimate state interest.”

In her article discussing these rulings, Supreme Court expert Amy Howe, in her Howe on the Court article that was published on the SCOTUS blog, offered that the Brnovich ruling “will make it more difficult to contest election regulations under the Voting Rights Act,” and thus likely means fewer voting rights cases coming through the courts. She further categorized this decision as a “major ruling.”

Continue reading

Oregon’s New Seat

Current Oregon US Congressional Districts Map


By Jim Ellis

July 2, 2021 — Oregon earned a sixth congressional seat in the 2021 apportionment, but exactly where that district will be placed on the Beaver State’s new map is not particularly obvious.

Like most states, Oregon handles redistricting through the legislative process and Democrats have firm control of all three legs of the legislative stool. In addition to Gov. Kate Brown (D), the party has a 18-11 margin in the state Senate with one Independent. Their majority in the state House of Representatives is similarly large, 37-22, with one vacancy. Yet, the partisan breakdown of the state might make drawing a solid 5D-1R map surprisingly somewhat difficult.

Currently, the five congressional districts are not obviously gerrymandered, as the seats are drawn in block form. Naturally, all but two cluster around the Portland metropolitan area, the state’s dominant population region.

The five incumbents are all senior, with Rep. Suzanne Bonamici (D-Washington County) being the most junior with her original election coming in a special 2012 contest. The delegation dean is House Transportation & Infrastructure Committee chairman Peter DeFazio (D-Springfield) who was first elected in 1986.

As you can see from the following chart, using 2019 population numbers since the Census Bureau will not be delivering census tract data to the states until after Aug. 15, the five districts are remarkably equivalent in relation to population size.

DISTRICT INCUMBENT 2020% POPULATION REG. VOTERS
1 BONAMICI 64.6% 858,875 570,186
2 BENTZ 59.9% 841,022 598,375
3 BLUMENAUER 73.0% 853,116 588,614
4 DeFAZIO 51.5% 820,504 588,508
5 SCHRADER 51.9% 844,220 578,609

The population figures suggest that each district will have to shed between 115,000 to 155,000 people in order to create six CDs with equal population, likely a number around 710,000 individuals for this state.

Continue reading