Monthly Archives: June 2021

Carey Claims Big Lead in OH-15

Graphic from Ohio Coal Association chairman and congressional candidate Mike Carey’s Facebook page.

By Jim Ellis

June 30, 2021 — Ohio Coal Association chairman Mike Carey (R) released his internal Fabrizio, Lee & Associates survey on Tuesday, which posts him to a big lead for the Aug. 3 special congressional primary in his state’s vacant 15th District. Carey’s advantage widely expands when the Republican primary electorate is aware that he is being endorsed by former president, Donald Trump.

According to the Fabrizio Lee poll (June 23-24; 400 likely OH-15 special Republican primary voters, live interviews), Carey would maintain a 44-10-9-8-5 percent advantage over state Rep. Jeff LaRe (R-Lancaster), former state Rep. Ron Hood, state Sen. Bob Peterson (R-Fayette County), and state Sen. Stephanie Kunze (R-Hilliard), respectively, among those claiming to be familiar with the campaign and candidates.

The original ballot test gave Carey a 20-9 percent lead over Rep. LaRe, who has the backing of resigned Rep. Steve Stivers (R) and is the beneficiary of the former congressman spending some of his substantial leftover campaign war chest as a support independent expenditure. Hood and Sen. Peterson trial with seven percent apiece, followed by Sen. Kunze’s six percent preference. The remaining six candidates individually garner three percent or less.

When all respondents are then informed that the former president has endorsed Carey, however, the candidate’s lead grows to a whopping 60-8-7-7-6 percent margin over Hood, LaRe, Peterson, and Kunze, respectively.

The initial ballot test also identified 44 percent of the respondents who said they are undecided about who to support in the special election. When informed of the Trump endorsement, the undecided segment then broke 46-3 percent for Carey over LaRe. Peterson and Kunze each gained one percent support, with the remainder divided among the minor candidates. This largely accounts for the big swing toward Carey when comparing the initial ballot test to the aided responses.

The poll was conducted during the buildup to Trump’s first public rally since he left the White House, an event held in rural Wellington, OH on Saturday about 40 miles due west of Akron that drew close to 20,000 people according to news estimates.

Continue reading

Where DeSantis Stands

By Jim Ellis

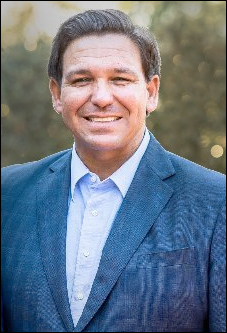
Florida Gov. Ron DeSantis (R)

June 29, 2021 — Florida Gov. Ron DeSantis (R) has been a hot political property of late, and no less than three political pollsters were in the field during late June to test his popularity in several scenarios.

Two of the firms, Echelon Insights and McLaughlin & Associates, tested Gov. DeSantis nationally in anticipation of a possible presidential run in 2024, while the Political Matrix/Listener Group surveyed the more timely Sunshine State 2022 governor’s race.

From the interactive voice response system poll released late last week, Political Matrix/Listener Group, on June 21, surveyed a total of 716 Florida likely voters who have a gubernatorial preference. They found DeSantis faring well against both announced Democratic gubernatorial candidates.

If US representative and former governor, Charlie Crist (D-St. Petersburg), were his 2022 general election Democratic opponent, Gov. DeSantis would hold a 55-45 percent advantage. Opposite state Agriculture Commissioner Nikki Fried (D), Florida’s only Democratic statewide elected office holder, the DeSantis margin would expand to a huge 61-39 percent spread; this, in a state where Republicans consistently perform a few points better than polling numbers typically predict.

The other two survey research firms tested Gov. DeSantis against a large number of commonly viewed ’24 GOP presidential prospects. Echelon Insights (June 18-22; 1,001 registered US voters, online from representative sample of registered voters) finds the governor topping the field of 19 named potential candidates within the 386 Republican primary voters segment with a 21 percent support figure, which is seven points higher than the former vice president, Mike Pence.

Donald Trump, Jr. posted seven percent, one point ahead of ex-UN Ambassador and former South Carolina governor, Nikki Haley, and Sen. Ted Cruz (R-TX) who both followed with six percent apiece. This group of five are the only potential contenders exceeding five percent preference. Former president, Donald Trump, was not included in the Echelon Republican nomination ballot test.

McLaughlin and Associates (June 16-20; 1,000 likely US voters, 444 GOP likely presidential primary voters) tested a two-tiered national GOP primary vote, one with former President Trump and one without.

If Trump does not run in 2024, McLaughlin, like Echelon, finds Gov. DeSantis to be the leading early candidate. In the field sans the ex-president, Gov. DeSantis places first with 24 percent followed by ex-VP Pence who attracts 19 percent, while Donald Trump, Jr. places third with 15 percent. Sen. Cruz (six percent) is the only other potential candidate who tops five percent of the vote.

Continue reading

Colorado Releases First New Map


District 1 – Rep. Donna DeGette (D-Denver)
District 2 – Rep. Joe Neguse (D-Lafayette/Boulder)
District 3 – Rep. Lauren Boebert (R-Silt/Western Slope)
District 4 – Rep. Ken Buck (R-Windsor/East Colorado)
District 5 – Rep. Doug Lamborn (R-Colorado Springs)
District 6 – Rep. Jason Crow (D-Aurora)
District 7 – New Seat
District 8 – Rep. Ed Perlmutter (D-Arvada/Thornton)


By Jim Ellis

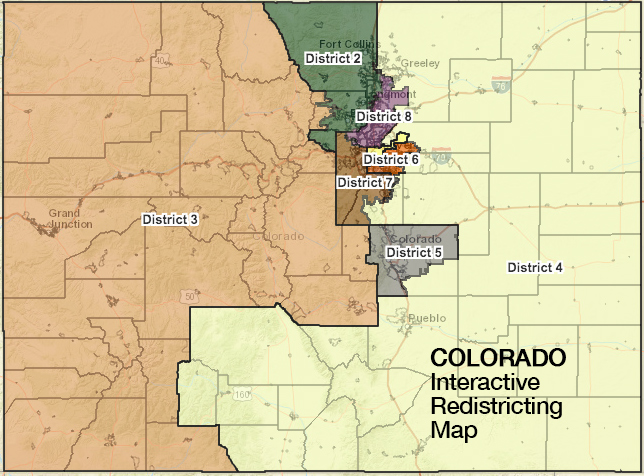
June 28, 2021 — The Colorado Independent Redistricting Commission, using only Census Bureau estimates because no state has yet received its census tract information and won’t until at least Aug. 15, released a preliminary new eight-district US House map late last week. Colorado is one of the states that gained a congressional seat under the 2020 national reapportionment.

The published commission map will not be the final version because population estimates and statistical sampling cannot be used for redistricting purposes per a 1999 US Supreme Court ruling (Department of Commerce v. US House of Representatives). Therefore, if this map is to become the basis for the actual plan, it will have to be adjusted after Colorado is presented with its census tract data.

This is the first redistricting cycle where Colorado has opted for the commission process. The new congressional map looks similar to the current seven-district design, in that the basic configurations of the seats and anchor population centers remain consistent with the notable exception of Rep. Ed Perlmutter’s (D-Arvada) current 7th District.

What appears designed as the new seat, District 8, takes a key population center from the 7th, the Arvada-Westminster-Thornton corridor, and makes it the new 8th CD anchor. This means the new 8th begins just north of Denver in Adams County and consumes about 85 percent of the local entity before moving slightly west to capture small Broomfield County and parts of Jefferson and Boulder counties. It then continues northeast to encompass a portion of Weld County.

Continue reading

Voting Poll — Some Surprising Responses Re: Voter Supression

By Jim Ellis

June 25, 2021 — New Jersey’s Monmouth University ran a national political survey (June 9-14; 810 US adults, live interviews) about the proposals being considered to change voting procedures at the national level and in many states. The result from several of the polling questions proved surprising.

As we know, the S.1/HR-1 legislation could not amass enough votes to invoke cloture against a Republican filibuster, thus killing it at least for a time. It is highly unlikely this measure could pass as currently written, but it is not out of the realm of possibility that another version of the voting bill will be considered later in the session. Additionally, election-oriented bills are alive in many states where legislatures have not yet adjourned for the year.

National political survey results of 810 US adults polled …

Monmouth tested the national sampling universe on a series of voting proposals and ideas, and their research effort may be one of the more extensive surveys published about the subject. Most of the responses were expected: people overwhelmingly favor enhanced mail voting, making the voting system more “user friendly”, and proof of identity.

Perhaps the most onerous provision in the S.1/HR-1 concept was the national prohibition of election officials asking for identity proof. The main argument is that the voter ID procedures “suppress” minority turnout. Monmouth’s surprising result, however, finds their labeled category of minority voters actually support the ID requirement in a larger proportion than the non-Hispanic white respondents.

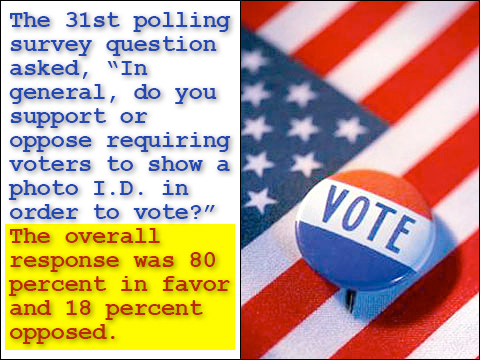
The 31st polling survey question asked, “In general, do you support or oppose requiring voters to show a photo I.D. in order to vote?” The overall response was 80 percent in favor and 18 percent opposed. Among those identified as Hispanic-Black-Asian-Other in the Monmouth crosstabs, the positive ratio rose to 84:13 percent.

This type of polling result shoots a major hole in the Democrats’ argument against the issue.

Their main opposition talking point is to suggest that many in the minority community cannot obtain an ID card, and thus the individual’s right to vote is suppressed, or denied. It is clear when analyzing this poll’s responses that a robust majority of these citizens don’t agree with such a characterization.

Continue reading

Tuesday’s NYC Elections Results Expected to be Available Next Month

By Jim Ellis

Brooklyn Borough President Eric Adams

June 24, 2021 — Voters in New York City reached one of the election cycle’s benchmarks Tuesday, the actual primary election day; but we are still weeks away from seeing a formal declaration of who won the races.

NYC has been notoriously slow in counting ballots in a system that is encumbered with an extra post-election period to receive absentee ballots on top of a pre-election day early voting phase. Last year, for example, it literally took six weeks to determine that Rep. Carolyn Maloney (D-Manhattan) had been re-nominated in the 2020 Democratic primary.

This year, the city adopted the ranked-choice voting method, which even in the fastest counting jurisdictions has added days if not more than a week to determine a winner. Therefore, we will see another long, but this time better-planned, counting period.

In this 2021 election, the city clerk has published a schedule that will allow absentee ballots to be received through June 29, which also will be the release of the first round of ranked-choice results. Those figures will only be a partial count, however, because no absentee ballots will be added until after the reception deadline. More ranked-choice totals will be released on July 6, which the city official says will include “some” absentee ballots. Further, and likely final, releases will then come the week of July 12 that will include “more complete” absentee ballot counts.

All in all, the counting of the election ballots continues to be a lengthy and laborious task.

The ranked-choice system takes effect because no candidate received majority support. Now, the last-place finisher, candidate Isaac Wright, is eliminated. Officials will locate the ballots that ranked him first, and then add those voters’ second choices to the full count. If no one still reaches majority support, the next candidate with the lowest number of votes, in this case Joycelyn Taylor, will then have her 1st choice ballots located and those voters’ second choice added to the overall count. This process continues until a candidate exceeds 50 percent.

Turning to what has been reported for last night’s tabulations, as predicted, Brooklyn Borough President Eric Adams has the lead as he has so far captured 32 percent of the counted votes. Civil rights attorney and activist Maya Wiley, with support from Rep. Alexandria Ocasio-Cortez (D-Bronx) and the party’s far left faction, placed second with 22 percent, just ahead of former NYC Sanitation commissioner Kathryn Garcia who pulled 19 percent.

Former presidential candidate Andrew Yang, who led early in many polls, is effectively eliminated as he placed fourth with just under 12 percent of the total vote, or almost 20 full percentage points behind Adams. Since it is unlikely that the ranked-choice process would catapult him back into serious contention, Yang conceded his fate in media interviews.

In the early counting, Adams has healthy leads in four of the city’s five boroughs. He is running strongest in the Bronx, where he leads Wiley and Garcia, 45-17-10 percent. He has an eight-point lead over Wiley in his home borough of Brooklyn, tops Wiley 33-19 percent in Queens, and holds a 31-20 percent advantage over Garcia in Staten Island. The only borough where Adams trails is Manhattan, where Garcia places first with 32 percent and Adams only slots into third with 19 percent, three percentage points behind Wiley.

Adams’ lead is such that he is likely to win the Democratic primary once the weeks pass and the final count becomes known. The Adams nomination victory will foretell him winning the mayor’s office in November, as New York’s 7:1 Democrat to Republican ratio leaves little doubt as to the general election outcome.

Two other New York mayors did not fare as well as Adams in their respective Buffalo and Rochester primaries. These cities did not employ the ranked-choice system, so their results are much clearer today.

Four-term Buffalo Mayor Byron Brown appears to have lost his bid to win re-nomination for a fifth four-year term with still about 50 precincts outstanding. He will likely fall to self-proclaimed socialist India Walton. At-large Rochester City Councilman Malik Evans scored a landslide nomination victory over Mayor Lovely Warren by a virtual 2:1 margin.

In addition to the NYC mayor’s race, all 51 city council districts were also on the ballot, and each must now go through the ranked-choice counting process. To see the New York City official election results in this era of lightning quick technology, we must turn the clock all the way ahead to the week of July 12.

The Controversy over Donald Trump’s Endorsement of NC Senate Candidate, Rep. Ted Budd


By Jim Ellis

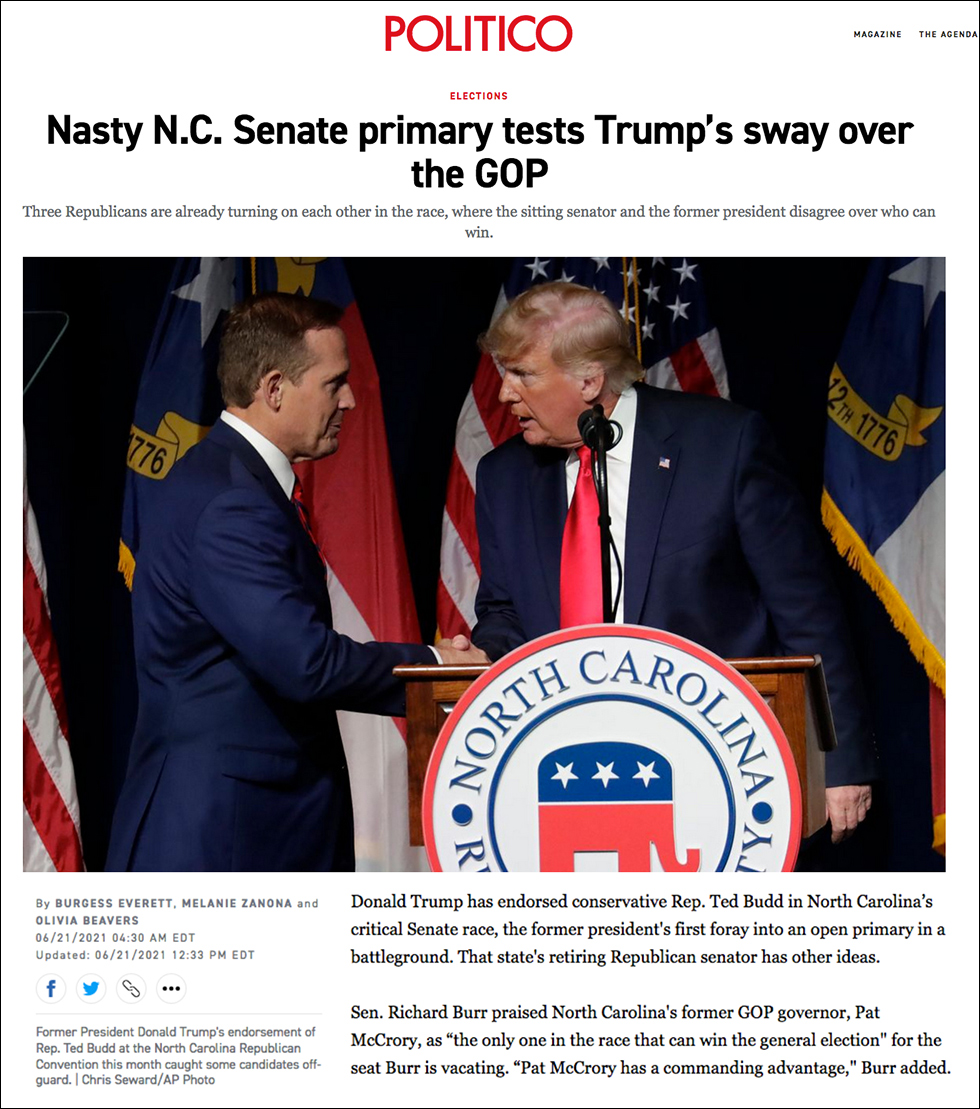
June 23, 2021 — Three Politico publication reporters, Burgess Everett, Melanie Zanona, and Olivia Beavers, combined on an article published yesterday (Nasty N.C. Senate primary tests Trump’s sway over the GOP) that merits refutation.

The piece details former President Trump’s public endorsement of US Senate candidate Ted Budd, the 13th District congressman, at the North Carolina Republican Party convention on June 5, and reactions to the development. Generally, and not surprisingly, it casts the endorsement and Rep. Budd’s statewide chances in a negative light.

Therefore, a number of points require balance.

1. To begin, the story quotes key Republicans, such as retiring North Carolina US Sen. Richard Burr (R) and South Carolina Sen. Lindsey Graham (R), who are downplaying the Trump endorsement’s effectiveness, with Sen. Burr going so far as claiming that ex-governor Pat McCrory is basically the only candidate who could win the upcoming general election. It is important to note here that McCrory failed to win re-election in 2016, the last time he was on a statewide ballot.

2. Secondly, a released Meeting Streets Insight poll conducted for the Budd campaign (June 9-10; 500 likely North Carolina Republican primary voters; live interview) highlights a different perspective.

The MSI survey found McCrory leading the GOP field 45-19-12 percent over Rep. Budd and former US representative, Mark Walker, respectively. When the polling sample is informed of the Trump endorsement – only 20 percent were aware before the pollsters provided the information – the ballot test completely flips to 46-27-8 percent with Rep. Budd leading, followed by ex-governor McCrory and former Rep. Walker. Obviously, this suggests the Trump endorsement still has power within the North Carolina Republican primary voter segment.

Continue reading

NYC and Ranked Choice on Ballot

NYC Democracy produced a voter palm card to help guide voters in a ranked-choice voting scenario.

By Jim Ellis

June 22, 2021 — New York City Democrats go to the polls today to cast their ballots in the party’s mayoral primary as 13 candidates compete to succeed term-limited Mayor Bill de Blasio (D). With voter registration figures giving Democrats an almost 7:1 advantage, there is little doubt that the eventual Democratic primary winner will win the mayoral general election on Nov. 2.

More, however, is on the ballot than just deciding which of the candidates will advance into the Autumn election. The Democrats are using a ranked choice voting system that has been tried in other places around the county, such as the state of Maine and 32 mostly local jurisdictions. With 13 candidates vying for the mayoral nomination, however, and at least four being within the margin of error in the most recent polling, this New York City race could be the system’s most significant test.

Ranked Choice Voting is an electoral procedure where voters rank the candidates in their order of preference. In this case, Democratic voters will record their first preference with the number 1, and then follow through individually with the remaining dozen.

The system works as follows: when the ballots are fully counted, assuming no one receives an outright majority, which is a virtual certainty with so many candidates in contention, the 13th-place finisher will be eliminated from further competition. Election officials will then locate all ballots where the last place finisher was chosen first. Those voters’ second choices are then recorded and added to the original count. This process continues until a top candidate reaches the 50 percent plateau.

Considering that New York City election officials took six weeks to determine a winner in Rep. Carolyn Maloney’s (D-Manhattan) 12th District congressional Democratic primary last year, for example, this complicated counting process could go on for some time before a winner is ultimately announced.

Pollsters attempted to gauge the voters’ ranked choice predilections in rather complicated questioning, and most estimated that the counting process would consume 10-12 rounds. Polling accuracy is unclear at this point because few research firms have attempted to measure the ranked choice system. Therefore, today’s race could have a wild card ending especially when voters go deep into their ratings.

Continue reading