Tag Archives: Texas

Analyzing the 2020 Turnout Increase

By Jim Ellis

March 29, 2021 — As we know, election year 2020 produced the largest voter participation level in history, including a substantial increase from the last presidential turnout in 2016. Now that all states have reported finalized election numbers, we know that a total of 158,507,137 individuals cast ballots in the 2020 presidential election, a number that shattered even the highest pre-election turnout predictions.

The figure also represents a 15.9 percent turnout increase when compared with 2016, which, at that time also set a record for raw number voter participation. Attempting to explain the large jump, the proponents of the election system overhaul legislative package in Congress, HR-1/S.1, credit the rise to the heightened use of early and mail voting, and therefore want to make permanent most of the court ordered COVID-19 pandemic response procedural changes. Digging deeper, however, we find that there are other factors present that help explain the voting uptick.

While all but five states (Alabama, Connecticut, Mississippi, Missouri, and New Hampshire) employed some form of early voting, another five conducted their elections only through the mail. The usual all-mail states of Colorado, Oregon, and Washington were joined by Hawaii and Utah according to the Ballotpedia election statistics organization that regularly publishes related data.

All five of these latter states saw turnout growth rates that exceeded the national average, including the state posting the highest increase, the Aloha State of Hawaii, which saw a whopping 32.5 percent rise in voting.

As stated earlier, the national average turnout increase when comparing the 2020 figures with 2016 is 15.9 percent. Eighteen states saw an increase greater than the national mean average, while 32 states and the District of Columbia fell below that number. All 51 entities, however, reported an upsurge in voting from 2016. The median average calculated to an increase of 12.8 percent.

Let’s concentrate on the 10 states with the highest increase from 2016. They are:

STATE        PERCENT INCREASE
Hawaii 32.5%
Arizona 31.6%
Utah 31.5%
Texas 26.2%
Idaho 25.8%
Nevada 24.9%
California 23.4%
Washington 23.2%
Tennessee 21.8%
Georgia 21.5%

Continue reading

One Down, 4 Special Elections to Go

By Jim Ellis

March 26, 2021 — Though Rep-Elect Julia Letlow’s (R) victory in Louisiana last Saturday completed one special congressional election, four others are still in-cycle and fresh ballot test data was just released from the Texas seat.

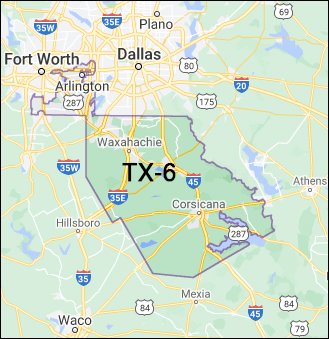
Next up on the schedule is the LA-2 double-Democratic runoff between state Sens. Troy Carter (D-New Orleans) and Karen Carter Peterson (D-New Orleans) on April 24. Next, on May 1, voters in Texas’ 6th District will go to the polls to begin the replacement process for the late Rep. Ron Wright (R-Arlington). Replacing Biden cabinet members and ex-Reps. Deb Haaland and Marcia Fudge will occur on June 1 and Nov. 2, respectively, in New Mexico and Ohio.

As in Louisiana, the Texas race features the late incumbent’s widow running, but a new poll suggests that Susan Wright’s support is not as deep as Letlow’s in neighboring Louisiana. On Saturday, Letlow, whose late husband, Luke Letlow, passed away three weeks after he won the December 2020 runoff election, scored a landslide 65 percent outright victory over 11 opponents.

In the North Texas race, the Democratic firm Global Strategy Group recently surveyed the 6th District electorate for their client, candidate Lydia Bean (D), during the March 11-16 period and interviewed 500 likely special election voters.

While the results found Wright leading the pack of 23 candidates, she reached only 18 percent support but that was nine percentage points better than her closest opponent, 2018 Democratic congressional nominee Jana Lynne Sanchez.

Freshman state representative and 2018 Republican congressional candidate, Jake Ellzey (R-Waxahachie), the only sitting elected official in the massive candidate field, followed closely behind with eight percent support. Bean, a non-profit organization founder, and former George W. Bush White House aide Brian Harrison were next, posting six percent apiece.

The results suggest that Wright has a clear lead, her advantage is by no means insurmountable and, at this point in the special election cycle, the data is certainly pointing to a pair of candidates advancing into a runoff election.

Under Texas special election procedure, the governor does not schedule the secondary election until it is clear that the runoff is necessary, and the participants chosen. In this case, we won’t know the date of the next election after May 1. It is presumed, however, that Gov. Greg Abbott (R) will schedule the runoff in mid to late July.

Continue reading

Louisiana Poll Shows Clyburn in Lead;
Nevada Candidate Shows Up in Texas

By Jim Ellis

Feb. 5, 2021 — In the Baton Rouge area, a pre-election favorite shows a solid lead, and in Texas, a surprise candidate who previously was the NV-3 GOP front-runner in the Las Vegas area enters a Texas race.


LA-2

Louisiana state Sen. Troy Carter (D-New Orleans)

A new survey for the upcoming March 20 special election in the New Orleans-Baton Rouge vacant 2nd Congressional District places the pre-election favorite into a discernible lead.

While state Sen. Troy Carter (D-New Orleans), who House Majority Whip Jim Clyburn (D-SC), the Louisiana Democratic Party, and resigned Rep. Cedric Richmond (D) have all endorsed, posts a 28-19 percent lead over state Sen. Karen Carter Peterson (D-New Orleans), he is nowhere near the 50 percent mark required to elect outright. Therefore, it appears the odds are strong that we will see a secondary runoff election on April 24.

A Silas Lee study of 450 “chronic” LA-2 voters conducted during the February 12-14 period but released only this week, gives Sen. Carter the nine-point advantage within a field of 15 candidates – eight Democrats, four Republicans, two Independents, and one Libertarian – thus, the pair of competing local state senators appear headed toward an April 24 runoff election. Finishing a distant third in the Lee poll with just six percent support is Baton Rouge community activist Gary Chambers, Jr. (D).

While Sen. Carter was dominant in New Orleans, he falls into third position when moving to the district’s Baton Rouge sector. There, Chambers led Sens. Peterson and Carter with a 14-12-7 percent respective spread.

The state’s vacant 5th District also will be settled within the same schedule, but no relevant polling data is readily available for that race. In both contests, early voting begins this Saturday, March 6, and will continue only through March 13, a week before actual Election Day voting takes place.

Continue reading

TX-6: Rep. Wright’s Widow to Run

By Jim Ellis

The late Rep. Ron Wright (R-TX) is sworn-into Congress Jan. 3, 2021 by House Minority Leader Kevin McCarthy (left) as Wright’s wife, Susan Wright, holds the Bible. Rep. Wright, 67, had been hospitalized with COVID-19; Susan Wright also had been hospitalized after contracting COVID-19. (Photo/Facebook)

Feb. 24, 2021 — The Texas Tribune newspaper broke the story this week that Susan Wright, widow of deceased Congressman Ron Wright (R-TX), will announce her candidacy as soon as this week for the yet unscheduled special election to succeed her late husband.

Ms. Wright will be the second recent widow running this year. Rep-Elect Luke Letlow’s death has led to a March 20 Louisiana special election in that state’s northeastern 5th District. Julia Letlow (R), the late-congressman-elect’s wife, is a candidate in that race and the favorite to prevail.

In US history, 39 widows have succeeded their late husbands in the House, and another eight in the Senate. One such widow, Doris Matsui (D-CA), is currently serving her ninth congressional term.

A large Republican potential field of candidates was thought to be building for the Texas special election, but with Susan Wright’s intention on becoming a candidate, that may block some of the local officials from the race. Freshman state Rep. Jake Ellzey (R-Waxahachie), who opposed Mr. Wright in the 2018 election and forced him into a runoff, and Katrina Pierson, the former Trump campaign spokeswoman, remain likely candidates, however.

At least two Democrats, 2018 congressional nominee Jana Lynne Sanchez and school district official Shawn Lassiter, have announced their candidacies and both are likely to remain in the race. The 2020 party nominee, Stephen Daniel, has also not ruled out running.

Now that the congressman has been laid to rest, Gov. Greg Abbott (R) will schedule the special election. The most likely date will be May 1st, in order to conform with the Uniform Election Day, which hosts local elections from around the state. All 6th District candidates will be on the same ballot and if any one candidate receives majority support, that individual will be elected outright. Otherwise, the top two finishers will advance to a runoff election that will be part of Abbott’s scheduling pronouncement. Assuming a May 1 special election, the secondary runoff would occur in late June or early July.

Continue reading

More Redistricting Delays – Part I

By Jim Ellis

Feb. 17, 2021 — The Census Bureau announced just before the Presidents’ Day holiday break that there will be yet another long delay in transmitting the census data to the states. Without the new numbers, redistricting becomes unachievable.

The new target date is Sept. 30, postponed from their first postponement date of July 30. At this point, the postponed apportionment release date remains April 30, long after the statutory deadline of Jan. 1. Apportionment is the first critical step in the redistricting process since this informs the states how many congressional seats they will be awarded for the current decade.

The late September target (and there’s no guarantee even this date will be met) will make it difficult for many states to finish their redistricting on time, and could force the process into the courts if state legislatures are unable to convene or meet a legislative calendar in terms of allowing public input. Even now, at least several states will have to enact emergency legislation to change deadlines to avoid violating pre-existing legal redistricting deadlines.

The delays have already changed the political situation in New Jersey and Virginia. With both states having odd-numbered year state legislative elections, the two are always the first to receive their new census data. In both states, legislative elections will now proceed under the 2011 maps with previously enacted amendments. When the lines are eventually completed, it is possible that new elections, possibly for 2022, will be ordered in Virginia. New Jersey voters passed a referendum in November that allows redistricting to occur before the 2023 state legislative elections.

Another problem could be lawsuits filed against the eventual apportionment. Apparently, the principal problem for the delays is exactly which people to count and where they are placed. College students, for example, are typically counted at the university campus on which they reside. Now, however, so many are not attending in-person classes. Therefore, arguments are ongoing as to where this group should be counted, either at school or back at their primary residence.

Additionally, one of President Biden’s new executive orders reversed Trump Administration policies about whether or not to count non-citizens. This change of direction has also created further delays.

Based upon these controversies, and others, it is probable that at least one potential losing state – apparently Alabama is on the cusp of losing a seat but may not depending upon the counting criteria – could sue over the apportionment conclusion meaning even further delays as various potential lawsuits wind their way through the judicial process toward final determination. All of this could conceivably mean redistricting is postponed until the 2024 election cycle.

Continue reading

More Redistricting Delays

By Jim Ellis

Jan. 29, 2021 — The Census Bureau announced at mid-week yet another postponement in releasing the national apportionment figures, this time until April 30. Reapportionment should have been completed by Dec. 31, but the Bureau previously announced that March 6 would be the new release date due to COVID-related problems. Now, we see further delays.

Reapportionment is the process of creating a new census data algorithm in order to project the number of congressional seats each state will be awarded for the coming decade. It appears that 10-12 seats could change states, with the northeast and Midwest typically losing districts to southern and western states. This time, however, California, for the first time in history, is reversing their trend and appears headed for the losing list.

Once the apportionment numbers are known and the individual data dispersed, the states can begin the redistricting process. The Census Bureau further stated that individual states won’t be receiving their particular data necessary for redistricting until at least July 30. This will clearly set the redistricting cycle back significantly, which could cause major problems for the coming election cycle.

In the past, the Census Bureau has prioritized the states with early primaries to be first to receive their data. This meant that New Jersey and Virginia initially received their new population numbers ahead of the others because they have odd-numbered year state legislative elections. Texas and Illinois were next to receive since they traditionally schedule their regular primaries in March of the election year.

Knowing that the numbers would not be available for them in 2021, New Jersey and Virginia took preparatory action. Garden State officials placed a referendum on the November ballot asking voters for approval to postpone legislative redistricting until 2023. The measure passed.

The Old Dominion leaders decided they would run their 2021 state Delegate elections on the amended 2011 map but could conceivably call elections again for next year once they receive their updated data and can draw district boundaries. Virginia state senators do not stand for election until 2023, so it is unlikely the redistricting delay will affect those campaigns.

The data distribution and processing delay could place most legislatures in a conundrum. Most will be adjourned when the data is received, so special sessions will have to be called in most cases to complete the process prior to the 2022 candidate filing deadlines. This suggests that the states having redistricting commissions might prove to be in better position to complete the task because they won’t have to deal with legislative politics, priorities, or calendars, all of which result in a lengthy process.

Additionally, since almost every map is challenged in court, we could well see a plethora of lawsuits being filed late in the year that keep the redistricting process tied in figurative knots for months.

The states in the most difficult situations will be those gaining and losing congressional representation. Because the number of districts these particular states will have differ from their current allotments, they do not have the option of reverting to the current map once 2021 apportionment becomes final.

In the case of gainers and losers not having completed maps, we may see at-large races for the House. This would be particularly difficult for the losing states because we may see all members in the affected places having to run at-large for seats in their House delegations.

Unofficially, the gaining states appear to be Texas (3 seats), Florida (2), Arizona, Colorado, Montana, North Carolina, and Oregon. The losers may be New York (possibly 2 seats), Alabama, California, Illinois, Michigan, Minnesota, Ohio, Pennsylvania, Rhode Island, and West Virginia. Reports suggest that the closest developing situation concerns whether Alabama loses a seat or New York drops two.

President Biden’s executive order that mandates non-citizens be counted in the census will certainly affect the final data projections and may be another reason for this latest delay.

The only certainty about 2021 reapportionment and redistricting is the many moving parts in these various states will likely produce surprising political results.

Early House Outlook – Part II

By Jim Ellis

Jan. 21, 2021 — Continuing with our electoral stage preview for the US House, today we look at 12 states in the country’s central region. Tomorrow and the following Monday, we move further east.


• Arkansas – 4 Seats (4R)

Arkansas holds four Republican districts, and the GOP controls the redistricting pen. They will obviously attempt to draw a new map that protects all four incumbents, and they should be able to do so with relative ease as the state continues to move toward the ideological right.

Arkansas had previously received Justice Department approval to draw a map where all of its 75 counties whole within the individual congressional districts, and thus exceeding the plus-or-minus one individual congressional district population variance requirement.


• Iowa – 4 Seats (1D3R)

Iowa has a hybrid redistricting system. The legislature voluntarily cedes power to a particular legislative committee, which then draws the four congressional districts based upon a mathematical population algorithm without regard to incumbent residences or political preferences. The legislature must then approve or reject the map without amendment.

The current map has produced competitive districts as is evidenced in the 2nd District being decided by just six votes in the 2020 election. Three of the state’s four CDs have seen both Republican and Democratic representation during this decade. It is likely we will see the process produce a similar map later this year.


• Kansas – 4 Seats (1D3R)

Both parties have seats at the redistricting table as Republicans control the state House and Senate while Democrats have the governorship. Republicans will attempt to at least protect the status quo but Democratic Gov. Laura Kelly can be expected to hold out for a 2R-2D plan. Any prolonged impasse will send the map to either a state or federal court in order to produce an interim map for the coming 2022 election.


• Louisiana – 6 Seats (0D4R; 2 Vacancies)

The more immediate political task Louisiana sees is filling its two vacant congressional districts. The New Orleans-Baton Rouge 2nd District has no representation because Rep. Cedric Richmond (D-New Orleans) resigned to accept a White House appointment from the Biden Administration. Rep-Elect Luke Letlow (R) tragically passed away after his election and before he was officially sworn into office. Therefore, both seats will be filled in a two-tiered March 20/April 24 special election calendar.

Republicans control the legislature, but Gov. John Bel Edwards (D) holds the veto pen. The number of seats will remain constant since the population appears relatively even through the state’s six districts. The 1st (Rep. Steve Scalise-R) and the 6th (Rep. Garret Graves-R) are over-populated while the 4th (Rep. Mike Johnson-R) and the 5th (Letlow vacancy) will need to gain residents.
Continue reading

Florida Data

By Jim Ellis

Dec. 18, 2020 — Continuing with our project this week of analyzing statewide data now that official final election results are being published from around the country, today we look at the Sunshine State of Florida, another key redistricting state.

Though having only three-quarters of Texas’ population, the Florida presidential turnout came within only a few hundred to equaling that of the Lone Star State (FL: 11,067,366; TX: 11,315,056).

On the statewide tally, President Trump carried Florida with a 51.2 – 47.5 percent margin over former vice president Joe Biden. The result represents a net 2.2 percentage increase for the president when compared with his 2016 statewide total, while Biden’s performance registered a decline of 0.3 percent from Hillary Clinton’s Sunshine State aggregate vote.

The House performance detected in California and Texas, showing that the average victorious congressional candidate performed better within their particular district than President Trump, was not nearly as pronounced in Florida.

On average, Texas US House Republican candidates ran 2.8 percentage points better than Trump, and the average California GOP House candidate ran 4.2 points ahead of the president’s statewide percentage. In Florida, however, the number was virtually equal to the president’s, with the average House Republican contender running just 0.2 percent above Trump’s statewide total.

Because two of the Republican incumbents, Reps. Neal Dunn (R-Panama City) and Mario Diaz-Balart (R-Miami/Hialeah), ran either without Democratic opposition (Dunn) or totally unopposed (Diaz-Balart) the Florida Secretary of State does not record votes in such a district. Therefore, for purposes of this exercise, a projected result of 65-35 percent for the two congressional districts was added as an estimated total. This percentage spread was extrapolated when comparing the performance of Republican and Democratic congressional candidates in similar Florida districts.

To review, in California, Democratic House incumbent performance fell below their 2018 recorded vote in 33 of 44 districts, while results improved for four of the six Republican incumbents on the ballot. In Texas, vote percentages for 11 of the 16 Republican incumbents seeking re-election improved from 2018, while the Democratic incumbent performance index declined for all 13 who ran for a succeeding term.

Continue reading

Texas Data

By Jim Ellis

Texas US House Districts

Dec. 17, 2020 — Yesterday, we analyzed the California official 2020 Statement of the Vote and today we turn out attention to voting statistics from the Lone Star State of Texas, a particularly interesting domain for the coming redistricting process. Estimates project that Texas will gain three congressional districts from reapportionment, which should become official at some point in January.

Despite predictions of a “blue wave” hitting Texas and putting the state in play for Joe Biden, Republicans once again swept the competitive races. Though President Trump’s margin did decline from 2016, his 52-46 percent margin was still more than comfortable, especially when considering he was simultaneously losing the nationwide vote.

As was the case in California, down-ballot GOP candidates, as a rule, performed better than President Trump. Sen. John Cornyn (R) was re-elected, and the GOP won 23 congressional races in the state, accounting for almost 11 percent of their party’s national total.

Sen. Cornyn topped 53 percent of the vote in recording a nine-point win over his Democratic opponent, retired Army helicopter pilot M.J. Hegar. In the 23 victorious Republican House races, the winning GOP candidate outpaced President Trump in 19 districts most of which were competitive at least to a degree.

Compared with the Democratic improvement in elections two years ago, the GOP rebounded in 2020. A total of 16 Republican incumbents sought re-election, and 11 of those improved their vote percentages from 2018. Additionally, all five of those falling below their previous benchmark did so by less than one percentage point.

For the Democrats, all 13 of their House incumbents saw a downgrade in their voter support from 2018. Rep. Henry Cuellar (D-Laredo), who fought off a tough Democratic primary challenge in early March, saw the biggest drop for any Texas House incumbent, falling from 84.4 percent in 2018 to a 58.3 percent win in November. The more serious drop, however, was for Rep. Vicente Gonzalez (D-McAllen) who won re-election to a third term from his South Texas district with just 50.5 percent of the vote against an opponent who spent only $404,000. Gonzalez’s victory percentage slipped from 59.7 percent in 2018.

The TX-15 district is largely a Mexican border seat that starts just east San Antonio in the Seguin area and travels south all the way through the city of McAllen in Hidalgo County. The latter entity hosts three-quarters of the 15th District’s population. Republicans, including President Trump, improved their standing throughout the Mexican border area in the 2020 election, which was a principal reason that Democratic gains in the Dallas, Houston, Austin, and San Antonio metropolitan areas were somewhat offset.

Statewide turnout was up a strong 23.7 percent when compared to 2016, enabling the state to exceed 11 million voters (11,315,056) for the first time. The Texas population grew 3.9 percent during that same time interval.

Continue reading

The Early Vote Predictor

By Jim Ellis

Dec. 3, 2020 — While it became clear that the plethora of polling data published during the 2020 election cycle again proved to be a poor predictor of eventual campaign outcome in most states, another resource was discovered that might be the more reliable prognosticator.

The states releasing early voting numbers before the election – not the actual election results, of course, but the numbers of Democrats, Republicans, and Unaffiliated voters who had returned their ballots – provided the opportunity of charting possible race outcomes. As a predictor, the early voting numbers, largely because they are actual votes and not extrapolations and estimates as found in polling, look to be a more reliable gauge.

Let’s examine the results in the key battleground states and compare them to both the 2020 and 2016 early voting numbers as compiled by the Target Smart organization. Target Smart monitored, categorized, and published the early ballot return numbers throughout the acceptance period in every state that publicly released such data. Unfortunately, for purposes of our exercise, the Georgia 2020 numbers are among the states not currently available.

In Arizona, we see a difference in the 2016 and 2020 early vote numbers that indicated a small shift in the voting patterns. Detecting that Democratic early vote participation had increased several points from four years ago while Republicans were down slightly did prove indicative in relation to the final Arizona result that yielded an official 10,457 vote Biden victory.

In Florida, we see the Democratic early vote numbers dropping slightly. This is a bit surprising in that 2020 featured a record voter turnout. The fact that Republicans gained a bit in the swing was a predictor of President Trump’s stronger performance in the Sunshine State as compared to the result from four years previous.

As we can see from the Michigan numbers, Democrats increased their early voting participation while Republicans saw a decrease. Unaffiliated voters substantially increased. Considering the final result, it is apparent that most of the Unaffiliateds voted Democratic in the presidential contest.

The North Carolina early vote numbers gave us our first clear indication that the pollsters were mis-casting the state’s electorate. The clear indication that Democrats were missing their marks in early voting while Republicans were exceeding their expectations was the first indication that the final vote would produce a different result than the plethora of polls were suggesting.

Pennsylvania featured drastic changes in not only the partisan early vote pattern, but also in volume as early voting increased by more than twelve-fold in comparison to 2016. The stark difference in Democratic versus Republican participation levels did forecast a swing to the former party, though the final totals were not as drastically different as the early voting yields.

Continue reading