Tag Archives: Quinnipiac University

Polling Updates: New Jersey, Virginia

Gov. Chris Christie

Gov. Chris Christie

New Jersey

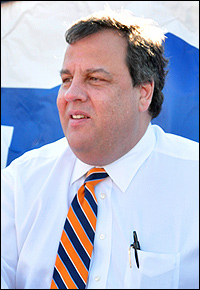
Fairleigh Dickinson University surveyed the New Jersey electorate (Jan. 2-6; 700 registered New Jersey voters), testing Gov. Chris Christie (R) against all comers.

For starters, the governor’s job approval rating remains in the stratosphere, as it has since Hurricane Sandy hit the state. Voters almost immediately began communicating positive impressions of the way he coordinated delivering aid to assist those suffering from the natural disaster. According to the data, a whopping 73 percent of the respondents give Christie’s job performance a positive rating, including Continue reading >

Gov. Chris Christie

Good News for Gov. Christie

Gov. Chris Christie

A new Rutgers-Eagleton New Jersey electorate poll (Nov. 14-17; 1,108 registered New Jersey voters) provides Gov. Chris Christie (R) with some very good news. According to the sampling universe, his job approval stands a 67 percent favorable to 26 percent unfavorable. But the better news for Christie is his standing against all potential Democratic rivals.

When paired with state senator and former Gov. Richard Codey, Christie’s margin is 56-31 percent. Against Newark Mayor Corey Booker, the governor stands at 53-34 percent. The numbers are even better when isolated with lesser-known potential Democratic rivals. Matched up against opposing former party chairman Tom Byrne, Christie soars to a 58-22 percent advantage. His gap grows to 60-22 percent when paired with state Sen. Barbara Buono and 60-21 percent when the opponent is Assemblyman Lou Greenwald. None of these individuals is an announced gubernatorial candidate.

Quinnipiac University is scheduled to release its latest New Jersey poll later today, but already leaked that their Christie job approval ratio is a whopping 72:21. It’s hard for a New Jersey Republican to begin an election year in better position. Gov. Christie is eligible to seek a second term next year.

Virginia Numbers Tell the Tale

(Official White House Photo by Pete Souza)

The Virginia State Board of Elections just released their 2012 results segmented by congressional district, the first state to do so, and the data give us further insight as to why Pres. Barack Obama again carried the Old Dominion. The state was long known to be one of the determining voting entities of the campaign, therefore the refined and newly released information carries national significance.

Statewide, voter turnout was reported to be 75.9 percent of the registered voters recorded as “active” by the Virginia state elections officials. The highest turnout district was that of House Majority Leader Eric Cantor (R-VA-7), as 82.8 percent of the central Virginia active registered voters participated. The lowest turnout rate was found in Rep. Gerry Connolly’s (D) northern Virginia 11th District where only 68.9 percent of active registered voters went to the polls.

At the congressional level, eight of the 11 districts were drawn to favor Republicans. The map performed as designed, because the eight GOP congressional incumbents all won re-election. In the presidential race, however, Obama obviously outperformed his Democratic congressional running mates, but only carried one more district than they. Obama won Districts 2 (Rep. Scott Rigell-R), 3 (Rep. Bobby Scott-D), 8 (Rep. Jim Moran-D), and 11 (Rep. Connolly). Therefore, despite GOP nominee Mitt Romney carrying seven of 11 congressional districts, he still lost the state. Obama’s official margin over Romney was 149,279 votes, meaning at least this many people are ballot switchers or did not vote in their individual congressional race.

Perhaps the most extraordinary finding is how Romney’s performance compared to the Republican congressional candidates. In all but one CD, the Republican congressional candidate recorded more votes than Romney. The lone exception was the western-most 9th District, commonly called “The Fighting Ninth” or the “coal district.” Here, Romney scored 11,456 votes more than Rep. Morgan Griffith (R), even though the latter was winning a convincing 61.3 percent re-election victory.

But it is the Northern Virginia seats where the most eye-opening results occurred. Despite not running competitive campaigns against Reps. Moran and Connolly, Republican candidates J. Patrick Murray and Chris Perkins in Districts 8 and 11, respectively, actually recorded more votes than did Romney. Murray secured 4,933 more votes than the Republican presidential nominee; Perkins garnered 9,441 tallies greater than Romney’s total. But none can come close to the results found in the new 10th District, where veteran Rep. Frank Wolf (R) out-polled Romney by 38,362 votes.

To put this in perspective, even though Murray received only 30.6 percent support against Moran and Perkins 35.5 percent in opposing Connolly, more people voted for them in these two districts than for Romney.

The other determining region was the Tidewater area, where the former Massachusetts governor failed to carry Rep. Rigell’s District 2 (he scored 48.6 percent there) and ran 12,466 votes behind the congressman, who won his first re-election with 53.7 percent. The other marginal Republican Tidewater CD, Rep. Randy Forbes’ (R) 4th District, showed an even greater difference between Romney and the congressional candidate. Here, Forbes ran 18,287 votes ahead of the man at the top of his party’s ticket. Romney eked out a 50.1 percent win over Obama, while Forbes racked up 56.9 percent in clinching his sixth re-election.

Comparing the presidential and congressional races to the Senate campaign between eventual winner Tim Kaine (D), the state’s former governor, and ex-Sen. George Allen (R), it was the Democratic candidate who carried the majority of the congressional seats — six to the Republican’s five. In addition to the seats that went for Obama (Districts 2, 3, 8 and 11), Kaine also carried Republican districts 4 and 10.

In more Virginia news, Quinnipiac University (Nov. 8-12; 1,469 registered Virginia voters) just released the first public survey of next year’s gubernatorial contest. Not surprisingly, the results determined that popular Sen. Mark Warner (D) would easily defeat both known Republican aspirants, Lt. Gov. Bill Bolling and Attorney General Ken Cuccinelli. Warner’s margins are 53-33 percent over Bolling and a similar 56-33 percent when paired with Cuccinelli. There has been speculation that Warner might enter the state’s 2013 governor’s race, thus giving him a better platform from which to launch a presidential campaign in 2016.

Former Democratic National Committee chairman and 2009 gubernatorial candidate Terry McAuliffe was likewise tested against the two Republicans. These match-ups suggest a much closer statewide race. Against Bolling, McAuliffe jumps out to a slight 38-36 percent lead; the margin becomes 41-37 percent when Cuccinelli is inserted as the hypothetical Republican nominee.

Tracking Ohio

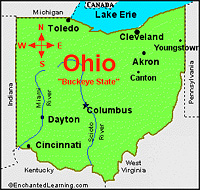
It can be argued that the presidential election is coming down to Ohio. It is very likely that the eventual winner will carry the Buckeye State, and that entity will be enough to put Pres. Barack Obama or Mitt Romney over the top nationally. There are other scenarios — either candidate losing Ohio but carrying Wisconsin and Colorado, for example – but the voting patterns suggest that Ohio will choose the winner.

That being the case, let’s check the latest Ohio polls. Six separate polls measuring the Obama-Romney campaign were just released and these are the results:

• Angus Reid (Oct. 18-20; 550 likely Ohio voters):
  Obama 48%; Romney 48%
• Gravis Marketing (Oct. 18-19; 1,923 likely Ohio voters via automated calls):
  47% Tie
• Public Policy Polling (Oct. 18-20; 523 likely Ohio voters):
  Obama 49%; Romney 48%
• Pulse Opinion Research for Let Freedom Ring organization (Oct. 15; 1,000 likely Ohio voters):
  Romney 47%; Obama 46%
• Quinnipiac University (Oct. 17-20; 1,548 likely Ohio voters):
  Obama 50%; Romney 45%
• Suffolk University (Oct. 18-21; 600 likely Ohio voters):
  47% Tie

Can it be any closer? For the second time in 12 years, deciding the presidency could come down to just a handful of votes.

The Shifting October Winds

Poll-watching

October is generally determination month for hot-race candidates, and now that it has begun prepare for some major swings in several political venues.

Recently, with Election Day coming in less than five weeks, we have seen polling that detects significant change in several Senate campaigns, all showing a shift away from the initial leader. With the Senate up for grabs, each race becomes critical and could itself determine whether Republicans or Democrats control the body in the new Congress. Today, we isolate four such campaigns.

In Connecticut, Quinnipiac University released its latest poll (Sept. 28-Oct. 2; 1,696 likely Connecticut voters, +/- 2.0 percent error factor) that finds Democrat Chris Murphy now trailing Republican Linda McMahon 47-48 percent. This is a surprising result and much different from the 48-42 percent Murphy lead that Public Policy Polling found just a week ago (801 likely voters, +/- 3.5 percent error factor). It is important to note that both polling firms have surveyed this race repeatedly. Having the opportunity to study another reputable firm’s results in order to bring a fresh perspective might provide us a better directional indicator.

Shifting to another hot race, we turn to Massachusetts and a recent poll by Opinion Dynamics for the consulting firm Mass Insight Global Partnerships. This rather flawed poll – because the sample size is less than 350 respondents statewide and the survey period is a long five days – posts Democrat Elizabeth Warren over GOP Sen. Scott Brown by a 48-44 percent clip. This same polling firm gave Brown a large 52-42 percent lead back in January. Last week, Rasmussen Reports also released their poll showing the candidates to be in a statistical tie at 48-48 percent (Sept. 24; 500 likely voters, 4.5% +/- error factor). Conversely, that very day, the Boston Globe publicized their data projecting Warren to be holding a five-point advantage over the freshman senator, 43-38 percent (502 likely voters, 4.4% +/- error factor). With continuous polling producing conflicting results it is clear this race is going to come down to the final hours.

Wisconsin continues to provide us with a close and hard-fought Senate race. Rep. Tammy Baldwin (D-WI-2) received a measurable bump in the wake of her speech at the Democratic Convention followed by an extensive early media advertising blitz, and polling indicates that the tide has turned in her favor. At least in the short term, Rep. Baldwin is now the clear front-runner over former four-term governor Tommy Thompson (R), after he consistently posted an advantage before and after the mid-August primary. Two recent polls show Baldwin leading: the first by Marquette University Law School showing a four-point edge, 48-44 percent (894 likely voters), and Real Clear Politics revealing a five-point advantage, 49-44 percent. Republicans, at one point, thought this seat would be a clear pickup opportunity, however, it is currently trending more Democratic. This polling trend could just as quickly snap back toward Thompson once he responds to the current line of attack being put forth against him.

Joining this see-saw Senate campaign group is the open seat race in Arizona. For months, Rep. Jeff Flake (R-AZ-6) had held a significant lead in all polling against Democratic nominee Richard Carmona, the former US Surgeon General in the George W. Bush administration. After consistently gaining ground on Flake after the Aug. 28 primary, Public Policy Polling, in their Oct. 1-3 poll of 595 likely Arizona voters, puts Carmona into the lead for the first time, albeit by a scant 45-43 percent margin.

It is clear, differing from what we have witnessed in the past four election cycles, that no tsunami wave is emerging for either party this year. As we turn the corner into the homestretch of campaign 2012, it is important to monitor all momentum changes as a barometer for predicting final outcomes.

Colorado Crazy


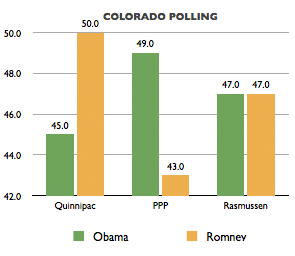
A trio of national pollsters just descended upon the swing state of Colorado and produced wildly divergent presidential campaign results. During the period of July 31 – Aug. 6, three national survey research firms each conducted a separate study of likely Colorado general election voters.

Quinnipiac University (July 31 – Aug. 6) surveyed a sample cell of 1,463 likely voters and actually found Republican Mitt Romney to be leading President Obama 50-45 percent. Public Policy Polling (Aug. 2-5; 779 likely Colorado voters), also in the field during the same period, found the exact opposite result: Obama ahead 49-43 percent. Finally, on Aug. 6, Rasmussen Reports conducted a one-day survey of 500 likely Colorado voters and projected the two candidates to be tied at 47 percent apiece.

The differing results tell us several things. First, the fact that we see the President leading by six in one poll, trailing by five in another, and tied in a third likely tells us that the Colorado electorate is split very finely between the two men. Second, all three polls reveal a very high degree of commitment. Those not expressing a defined choice were only in single-digit percentiles for all three polls. Third, the data also suggests that this state, which typically splits its votes rather evenly between candidates of the two parties, is clearly in play for both presidential contenders. In 2008, then-Sen. Barack Obama carried Colorado over his colleague John McCain by a 54-45 percent margin but, today, it appears the 2012 result will be much closer.

Presidential Popular Vote is Even

President Obama. / Photo: The White House

A series of new presidential election polls reveals a further tightening of the campaign on the national level, though President Obama maintains a lead over Mitt Romney in the most competitive states.

The two daily tracking pollsters, Gallup and Rasmussen Reports, both give the president only a one-point national lead, 46-45 percent and 45-44 percent, respectively. Looking at an actual benchmark survey, Public Policy Polling, conducting their study (July 19-22; 1,000 registered voters) for the Daily Kos national liberal blog and the Service Employees International Union, projects a flat 46-46 percent tie.

The only national poll not showing a dead heat, taken over virtually the same time frame as PPP’s survey with an identical sample size (July 18-22; 1,000 registered voters) from Republican pollster Bill McInturff and his Democratic counterpart Peter Hart, actually stakes the president to a 49-43 percent advantage. Based upon the available data, though the polling methodology appears sound, the McInturff/Hart result appears to be an outlier.

National Public Radio released their poll of the 12 commonly viewed battleground states (conducted by the Resurgent Republic and Democracy Corps organizations, July 7-12; 1,000 voters nationwide with an oversample of 462 from the battleground states) but its aggregate result is of little consequence. Though this poll, too, shows an Obama-Romney tie at 46 percent, such a figure is virtually useless because the combined popular vote in the most hotly contested states doesn’t translate into specific electoral votes.

What is valuable are battleground voters’ perceptions and attitudes about the candidates. As we have seen for months, there is severe polarization between the two major parties. By almost a 9:1 majority, Democrats believe the president has performed well in office. Conversely, the same virtual ratio of Republicans believes he has not. Independents tend to fall more on the Republican side, slightly rating Obama’s job performance more negative than positive. Also, Independents in these states generally oppose the Obama healthcare law and, by a slight margin, believe that the Supreme Court decision upholding the law is incorrect. This could prove significant as the campaign continues to evolve.

One thing that does deviate somewhat from at least the conventional wisdom, the NPR battleground state poll does show that both candidates have a strong base. Especially for Romney, this is a change. Before, most data indicated weakness among Republicans for their presumptive nominee, but the NPR data gives both contenders right around 90 percent support within their own party voter cell sample. This finding is good news for both men.

New individual key state surveys stack up relatively well for the president in the fact that he leads in most, but in no case is his advantage more than mid-level single-digit numbers.

Rasmussen Reports gives the President a six-point, 48-42 percent advantage in Michigan. Survey USA finds a similar five-point, 48-43 percent margin for Obama in all-important Florida; and We Ask America returns similar 49-42 percent and 49-43 percent spreads (in Obama’s favor) in Wisconsin and Nevada, respectively. Magellan Strategies produced a much closer 50-46 percent Nevada model. Quinnipiac University shows a tie in Virginia, and the Civitas Institute projects Romney to a one point, 49-48 percent razor-thin edge in North Carolina. Though it’s not a battleground state, Survey USA detects only a 46-40 percent advantage for the president in liberal Minnesota, which is a surprise.

The cumulative effect of the most recent survey data makes the president and his advisers uncomfortable. These are not the type of results strong incumbents would be seeing at this point in the election cycle. It’s going to be quite a remainder of the year.