
Tag Archives: Michigan

Redistricting Is Now Underway

By Jim Ellis

Aug. 13, 2021 — Now four full months past the original deadline, the Census Bureau finally is scheduled to deliver to the states their census tract data, thus enabling the map-drawing process to begin.

While data was received yesterday, it will still be awhile before the public begins seeing even preliminary maps. The data must first be configured to the individual state’s redistricting software. Secondly, most state processes mandate hearings for public comment once the data is released. Each of these factors will happen prior to actual map construction. This notwithstanding, the critical element for each state, having the necessary data, is at long last occurring.

At the end of last year, we published a redistricting outlook that suggested Republicans, even though they control the process in a preponderance of states, could still find themselves down several seats in reapportionment and redistricting simply because of what could happen in the states that are gaining and losing congressional seats. (Go to: Ellis Insight Redistricting Outlook)

Some notable changes have occurred since the original piece was written, and now it appears the tables have turned toward the GOP as the party in best position to benefit nationally from the decennial district reconstruction process.

Below is a recap of the state situations that have changed:


Alabama: The original reapportionment prognostications suggested that Alabama would lose a congressional district. Republicans, because they control all but a Civil Rights-protected seat, were sure to take the loss. Likely due to a population surge in the latter part of the decade, Alabama did not lose a seat, thus the GOP saves a sure net loss.


Colorado: Though Colorado has adopted a redistricting commission for the first time, the swing toward the Democrats suggested that their party would gain the new seat. The Colorado commission is the first to release a congressional map, based upon Census Bureau estimates, and while the new 8th District looked solidly Democratic, the newly configured 7th District, currently Democratic, slightly favors the GOP.

Though this map is just a preliminary draw, should this be the direction in which the commission heads Republicans could actually reap a one seat gain when the 2022 election cycle concludes.

Continue reading →

The Michigan Wild Card

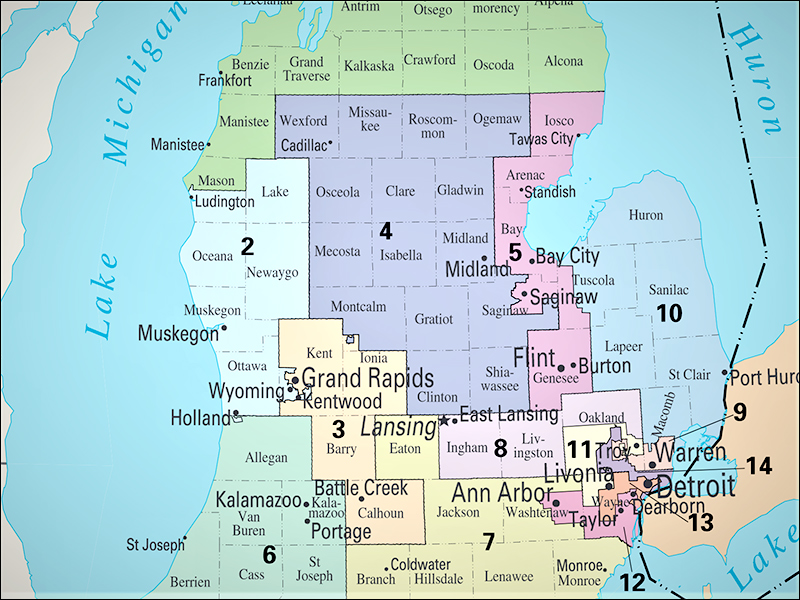
Michigan Congressional Districts


By Jim Ellis

July 16, 2021 — For the third consecutive census, the Wolverine State of Michigan loses a congressional seat but this time it is more difficult to determine how the new map will be drawn and which of the state’s 14 US House members, comprised of seven Democrats and seven Republicans, will be the odd member out.

The big change is that for the first time a citizens’ commission, and not the state legislature, will draw the map. The 13-member commission has been conducting briefings to organizations around the state since April 3 and has public input meetings scheduled with those that began July 8 through Aug. 26.

What places Michigan in a wild card situation, however, won’t become clear until the US Census Bureau sends the state its individual tract data that will arrive on or around Aug. 15. At that point, the key question will be answered as to just how many people the city of Detroit has lost. This will be the critical factor in determining how the new congressional map is constructed.

Like every state, Michigan is bordered on all sides meaning the members with districts on the edge are typically in better defined position than those residing in the geographic middle. In this state’s case, the Great Lakes surround the split land masses on the north, east, and west, with Canada lying to its north and east, and Indiana and Ohio to the south.

Looking at the available public population data that only is current through July 1 of 2019, all current 14 districts must gain residents, hence the state losing a CD, with three most significantly holding the fewest people. Those three are the two Detroit seats, Districts 13 (Rep. Rashida Tlaib-D) and 14 (Rep. Brenda Lawrence-D), and the Flint-anchored seat, District 5 (Rep. Dan Kildee-D). All three are likely to need an influx of more than 100,000 people apiece.

Continue reading →

Dueling Dual Polls

By Jim Ellis

Detroit Police Chief James Craig

June 14, 2021 — We open the week looking at conflicting polls from two Midwestern statewide races. The Michigan Republican Party published a survey that conflicts with earlier data we’ve seen about their state’s gubernatorial race, and the two leading Ohio Republican Senate contenders both released recent surveys that best tell their own campaign story.

In the Wolverine State, the Competitive Edge Research & Communication firm, polling for the Michigan Republican Party (May 26-June 4; 809 likely Michigan voters), projects retired Detroit Police Chief James Craig (R), who is soon expected to announce his bid for governor, leading incumbent Gretchen Whitmer (D) by a spread beyond the polling margin of error, 45-38 percent.

Curiously, the MIGOP leadership also released the ballot test that featured the party’s 2020 and 2018 US Senate nominee, John James. Here, the CERC finds Gov. Whitmer leading James, 50-45 percent. James has not indicated that he is going to enter the gubernatorial race, so it is surprising to see the Republican Party releasing data that puts one of their top political figures in a weaker position. James lost the 2020 Senate race to incumbent Gary Peters (D) by a tight 50-48 percent count.

In May, the Target Insyght survey research company (May 9-11; 800 registered Michigan voters) painted a different picture, forecasting a 48-42 percent lead for Gov. Whitmer over Craig and 49-39 percent against James.

The difference could be attributed to James retiring as chief of police after the TI poll was conducted and before the CERC survey was taken. Former chief Craig is a well-known and popular figure in Detroit, and the accolades given him for his tenure could certainly have helped his polling data at least on a short-term basis.

Additionally, Gov. Whitmer has been caught in several inconsistencies regarding her COVID shutdown policies, which were some of the most drastic in the country. More than once, she was found not following the letter of her own directives for herself and family.

Continue reading →

Census Delays: Some Ramifications

By Jim Ellis

June 1, 2021 — As we know, the Census Bureau has delayed in meeting its public reporting deadlines, which causes ramifications in the political world. As a result, the state officials responsible for redistricting could well find themselves placed behind the proverbial eight ball as the new year approaches.

Reapportionment is the term used to explain the entire decennial process. Reapportionment, as the US Supreme Court defined it in their 1999 ruling on the US Census Bureau v. House of Representatives case, is basically divided into two parts. The first, which was finally completed and released on April 26, is the allocation of congressional seats to the states. The second is the re-drawing of congressional, state, and local district boundaries most often referred to as redistricting.

To complicate matters even further, the delayed allocation proved much different – affecting six seats to be exact – than predictions. It was believed for at least two years that Texas would gain three seats in the 2020 reapportionment and Florida two, with Arizona, Colorado, Montana, North Carolina, and Oregon adding one seat apiece. The actual numbers found Texas gaining two, Florida one, and Arizona none. The other one-seat gaining states were correctly predicted.

Conversely, Alabama, California, Illinois, Michigan, Minnesota, New York, Ohio, Pennsylvania, Rhode Island, and West Virginia were all expected to lose one seat apiece. The actual report found Alabama, Minnesota, and Rhode Island each retaining the same number of seats they held in the 2010 reapportionment, while the others did lose a single district apiece.

The Census Bureau claims that COVID is largely responsible for their delays, but the state of Alabama, in their pending lawsuit against the federal statistical entity, disagrees. Alabama claims the deadline violations occurred because of the Bureau’s attempt to impose, for the first time in history, differential privacy over the data. This means, under the argument of protecting individual privacy, data would be deliberately scrambled, and certain information not publicly released.

Differential privacy alone would make redistricting extremely difficult for state map drawers because the released census tract numbers, now by definition, wouldn’t equal the state population figures brought forth earlier in the year. The effect would cause political havoc throughout the country. A court ruling on the Alabama case is expected shortly.

Because of a successful legal challenge from Ohio, the Census Bureau has agreed to make the data necessary for redistricting available to the states by Aug. 15 instead of the Oct. 1 date indicated when allocation was announced.

Continue reading →

Another Close Michigan Race

By Jim Ellis

Detroit Police Chief James Craig

May 18, 2021 — As it is becoming clear that retiring Detroit Police Chief James Craig (R) is preparing to challenge Michigan Gov. Gretchen Whitmer (D) next year, Target Insyght, polling for the Michigan Information & Research Service (MIRS), tested the potential general election pairing in a recent study. The results portend another tight Wolverine State campaign.

The TI poll (May 9-11; 800 registered Michigan voters, live interview) finds Gov. Whitmer leading Chief Craig by a six-point, 48-42 percent, spread. More importantly, the survey identified key areas of weakness for the governor, ones that could potentially allow a GOP contender to construct a reasonable path to victory. Chief Craig has not yet announced his candidacy but is expected to do so once he officially retires from the police force on June 1.

Where Chief Craig may have a significant advantage in such a race is his potential ability to draw more votes from the African American community particularly in heavily Democratic Detroit.

While President Biden averaged 79.1 percent of the vote in Congressional Districts 13 and 14 that encompass the city, the Target Insyght poll finds Gov. Whitmer pulling only 64 percent among black voters, while the outgoing police chief attracts 36 percent. In Detroit, 78.3 percent of the population is African American according to the latest publicly available Census Bureau estimates (July 2019).

Gov. Whitmer’s bigger weakness, however, lies in the area of jobs and rebuilding the state’s economy. According to this issue segmentation, voters would favor Chief Craig over Gov. Whitmer by a whopping 63-30 percent margin.

John James, the African American Republican who has run highly competitive campaigns in the last two consecutive Michigan Senate races, was also tested but he doesn’t perform as well as Chief Craig in a general election pairing. While the governor tops Chief Craig by six points, as mentioned above, James trails by 10 percentage points, 49-39 percent.

In the Republican primary, however, it is James who would have a clear advantage. If he and Chief Craig oppose each other for the 2022 GOP gubernatorial nomination, the former man would begin the race with a 36-21 percent advantage in the primary according to this particular survey.

Continue reading →

Apportionment Surprises


By Jim Ellis

April 28, 2021 — In virtually every 10-year apportionment announcement at least one surprise occurs, but the census unveiling Monday contained multiple blockbusters.

For example, two states had their final number of congressional districts determined by less than 90 people. Reportedly, if New York had just had 89 more people, that would have saved an Empire State congressional seat. Minnesota becomes the beneficiary allowing the state to barely hold its eighth district.

Instead of 10 seats changing states as had been forecast, only seven, affecting 13 domains, switched. Perhaps the main reason for the lower number is the decade population growth rate. According to yesterday’s final report, the nation grew at only a 7.4 percent rate, the lowest since the 1930 census’s 7.3 percent. By contrast, the population increase from the 2010 total was 9.7 percent.

Pre-census projections, for better than a year, had been predicting that Texas would gain three seats, Florida two, and Arizona one. The analysts also estimated seat losses for Alabama, Minnesota, and Rhode Island. None of these projections proved accurate.

On the other hand, prognostications for the balance of the map were accurate. Texas, and Florida did gain, but two and one, respectively, instead of three and two seats. Colorado, Montana, North Carolina, and Oregon each added one district apiece as expected. The one-seat losers were California, for the first time in history, Illinois, Michigan, New York, Ohio, Pennsylvania, and West Virginia.

It’s a bit too soon to determine which party will benefit the most from these numbers at the congressional level, though Republicans should be up slightly in the Electoral College for the next presidential campaign. Once we see how the population is distributed within the states will better tell us whether Democrats or Republicans will take the most advantage of the apportionment. This will depend upon how the population spreads through the cities, suburbs, and rural regions.

Continue reading →

More Redistricting Delays – Part II

By Jim Ellis

Feb. 20, 2021 — Yesterday, we covered the Census Bureau announcement that delivering new population data to the individual states will again be postponed, and what effect receiving numbers in October, if then, will have on the redistricting process.

Today, after previously analyzing the states that appear poised to gain seats, we look at those that will probably lose districts. At this point, estimates project that 10 seats will be transferred. This, however, is only a projection as the current published numbers do not include the final changes in the previous decade’s last year.

At this point, all of the succeeding states appear positioned to lose one seat. The individual state logistical data comes from a study that the Brennan Center for Justice just released.


Alabama

It appears that Alabama is on the cusp of losing a seat depending upon who is counted and where they reside. This specifically refers to college students and non-citizens. President Biden’s executive order countermanding President Trump’s directive not to count non-citizens may have an effect upon Alabama’s status. Officials there may sue over the apportionment if, in the final count, the state loses one of their seven districts.

It is likely that Alabama redistricting will be pushed into 2022 irrespective of the apportionment decision because the legislature will be out of session when the data is finally delivered. The state’s May 24 primary could conceivably be postponed.


California

For the first time in history, California is likely to lose a seat in apportionment. The 2010 apportionment cycle was the first in which the state did not gain representation. In the 1980 census, for example, California gained seven seats.

The Golden State has a redistricting commission, but the data postponement may force the process into a secondary mode since the redistricting completion deadline is Aug. 15. Unless the deadlines are changed, the state Supreme Court will appoint a special master to draw the map. California’s March 8, 2022 primary may have to be postponed, and almost assuredly their Dec. 10 candidate filing deadline will have to move.


Illinois

The state legislature has the redistricting pen, but Illinois also has a backup commission empowered in case the regular process is not completed. A March 15, 2022 primary and certainly a Nov. 29 candidate filing deadline, however, could and will face postponement.


Michigan

Voters previously adopted the institution of a 13-member commission to draw maps. The commissioners, now appointed, consist of four Democrats, four Republicans, and five unaffiliated voters.

With an April 1, 2022 candidate filing deadline and an Aug. 2 state primary, the Michigan system should have time to complete the redistricting process without changing their election cycle calendar.
Continue reading →

More Redistricting Delays

By Jim Ellis

Jan. 29, 2021 — The Census Bureau announced at mid-week yet another postponement in releasing the national apportionment figures, this time until April 30. Reapportionment should have been completed by Dec. 31, but the Bureau previously announced that March 6 would be the new release date due to COVID-related problems. Now, we see further delays.

Reapportionment is the process of creating a new census data algorithm in order to project the number of congressional seats each state will be awarded for the coming decade. It appears that 10-12 seats could change states, with the northeast and Midwest typically losing districts to southern and western states. This time, however, California, for the first time in history, is reversing their trend and appears headed for the losing list.

Once the apportionment numbers are known and the individual data dispersed, the states can begin the redistricting process. The Census Bureau further stated that individual states won’t be receiving their particular data necessary for redistricting until at least July 30. This will clearly set the redistricting cycle back significantly, which could cause major problems for the coming election cycle.

In the past, the Census Bureau has prioritized the states with early primaries to be first to receive their data. This meant that New Jersey and Virginia initially received their new population numbers ahead of the others because they have odd-numbered year state legislative elections. Texas and Illinois were next to receive since they traditionally schedule their regular primaries in March of the election year.

Knowing that the numbers would not be available for them in 2021, New Jersey and Virginia took preparatory action. Garden State officials placed a referendum on the November ballot asking voters for approval to postpone legislative redistricting until 2023. The measure passed.

The Old Dominion leaders decided they would run their 2021 state Delegate elections on the amended 2011 map but could conceivably call elections again for next year once they receive their updated data and can draw district boundaries. Virginia state senators do not stand for election until 2023, so it is unlikely the redistricting delay will affect those campaigns.

The data distribution and processing delay could place most legislatures in a conundrum. Most will be adjourned when the data is received, so special sessions will have to be called in most cases to complete the process prior to the 2022 candidate filing deadlines. This suggests that the states having redistricting commissions might prove to be in better position to complete the task because they won’t have to deal with legislative politics, priorities, or calendars, all of which result in a lengthy process.

Additionally, since almost every map is challenged in court, we could well see a plethora of lawsuits being filed late in the year that keep the redistricting process tied in figurative knots for months.

The states in the most difficult situations will be those gaining and losing congressional representation. Because the number of districts these particular states will have differ from their current allotments, they do not have the option of reverting to the current map once 2021 apportionment becomes final.

In the case of gainers and losers not having completed maps, we may see at-large races for the House. This would be particularly difficult for the losing states because we may see all members in the affected places having to run at-large for seats in their House delegations.

Unofficially, the gaining states appear to be Texas (3 seats), Florida (2), Arizona, Colorado, Montana, North Carolina, and Oregon. The losers may be New York (possibly 2 seats), Alabama, California, Illinois, Michigan, Minnesota, Ohio, Pennsylvania, Rhode Island, and West Virginia. Reports suggest that the closest developing situation concerns whether Alabama loses a seat or New York drops two.

President Biden’s executive order that mandates non-citizens be counted in the census will certainly affect the final data projections and may be another reason for this latest delay.

The only certainty about 2021 reapportionment and redistricting is the many moving parts in these various states will likely produce surprising political results.

Early House Outlook – Part III

By Jim Ellis

Jan. 22, 2021 — Continuing with our electoral preview for the US House, today we look at 13 states in the country’s northeastern region. Monday, we conclude in the south.


• Connecticut – 5 Seats (5D)

With all of the Nutmeg State’s five congressional districts venturing past the 700,000 resident mark, each of Connecticut’s CDs appear secure after the state lost a seat in 2010 reapportionment. With Democrats holding the redistricting pen, expect only perfunctory changes in the congressional delegation map with each incumbent being awarded a safe seat. All were re-elected in 2021 within a vote percentage range between 56 and 65.


• Illinois – 18 Seats (13D – 5R)

Democrats have a big advantage in the Illinois delegation and, with the party leaders in control of the redistricting pen, their edge is positioned to expand. Despite the Republicans holding less than half of the number of Democratic seats comprising the delegation, it is one of the Dem’s members who is likely to be paired with another incumbent.

The state has actually lost population (approximately 250,000 residents) when compared with the 2010 census, meaning Illinois will certainly lose one CD with the outside possibility of dropping two. Since the major population loss is coming from the downstate area, the Democrat map drawers will have little trouble taking the seat from the Republicans and can justify such a draw based upon the region losing so many people. This, even though Rep. Cheri Bustos’ (D-Moline) seat has the lowest population figure in the state.

The Chicago area gives the Democrats some redistricting challenges, however. Three of their metro incumbents, Reps. Marie Newman (D-La Grange), Sean Casten (D-Downers Grove), and Lauren Underwood (D-Naperville) scored re-election percentages of 56.4, 52.8, and 50.7 respectively, meaning all three will be lobbying to add more Democrats to their districts. Their lower win percentages are a clue that the metro districts are already stretched to the maximum from a Democratic perspective, so it’s possible such an over-reach could have backfire potential.


• Indiana – 9 Seats (2D – 7R)

The nine Hoosier State seats also appear secure from a population standpoint, so Indiana looks to be a sure bet to retain all of its nine congressional districts. One seat to watch from a competitive perspective is that of freshman Rep. Victoria Spartz (R-Noblesville), who won an Indianapolis suburban CD in a tight 50-46 percent margin. Democrats will target her in 2022. All of the veteran incumbents seeking re-election broke the 61 percent mark. Freshman Democrat Frank Mrvan (D-Highland/Gary) succeeded retiring Rep. Peter Visclosky (D) with a 57-40 percent victory margin.


• Maine – 2 Seats (2D)

The Pine Tree State again holds two districts with smaller base population figures for the coming decade, one from the north and the other south. Democrats hold both and will control the redistricting pen but with only approximately 30,000 people needing to move from the southern 1st District (Rep. Chellie Pingree-D) to the northern 2nd (Rep. Jared Golden-D), the map will only change marginally. The 2nd CD is the more competitive seat of the two and will again be contested but the state’s Ranked Choice Voting system tends to give the Democrats an added advantage.


• Massachusetts – 9 Seats (9D)

The Bay State, home to one of the Democrats’ most loyal constituencies in the entire country, will retain its nine districts after dropping a seat in the 2010 reapportionment. All nine Democratic incumbents are safe and will continue to be so. The victory percentage range fell between 58-74 percent for the nine current Democratic incumbents, all but one of whom was running for re-election.


• Michigan – 14 Seats (7D – 7R)

Michigan redistricting will be different in 2021 with the introduction of a voter-passed redistricting commission. The citizen members will be tasked with reducing the 14-member delegation to 13, and Republicans will likely find themselves on the short end. Rep. John Moolenaar’s (R-Midland) 4th CD looks to be the most vulnerable. The districts in the northern part of the state all must gain population, and with Rep. Moolenaar’s seat being surrounded by the rest, his is the most likely to be split in pieces order to feed the others.

Reps. Elissa Slotkin (D-Holly/Lansing) and Haley Stevens (D-Rochester Hills), with respective 2020 win percentages of 50.9 and 50.2, will be in need of more Democrats that may not be forthcoming. Therefore, we could see a more competitive Michigan congressional delegation at least in the early part of the new decade.
Continue reading →

The Losing Regions – Part I

By Jim Ellis

Dec. 23, 2020 — With the Census Bureau readying the national apportionment formula to present to the Clerk of the House at some point next month, it is a reasonable time to again look at the states projected to lose congressional districts and begin to determine where a dragging population could cost a region its current representation.

Today, we look at four states projected to lose a district: Alabama, California, Michigan, and Minnesota. Tomorrow, we will examine Illinois, Ohio, Pennsylvania, and New York. Rhode Island and West Virginia are also going to lose seats but because they are two- and three-district states, the new redistricting map becomes obvious, particularly in the former’s case.


Alabama

The Alabama population suggests that it is too small to keep its seventh congressional district, but such makes the remaining six districts very large, likely well over population figures of 800,000 residents apiece. It is an ironic problem for the states losing districts in that the remaining CDs actually become much larger. If Alabama is on the losing end in final reapportionment, the scenario of dropping a district and making the remaining seats much larger will certainly come to pass.

As with all redistricting, those in a corner of a state, i.e., either bordered by another state, body of water, or country are in the best shape because their districts can only expand or contract one or two ways. In Alabama, the 1st and 5th CDs, those of incoming Rep. Jerry Carl (R-Mobile) and Mo Brooks (R-Huntsville) are in the most favorable geographic positions.

The district appearing to lose the most population is Rep. Terri Sewell’s (D-Birmingham) 7th CD, but this is a protected Civil Rights district meaning it must be protected. The seat could need to gain almost 150,000 people according to rudimentary calculations, and the most likely place for the increase comes from Montgomery County at the expense of the 2nd District and possibly the 3rd.

The 2nd District, even when bordered by states on two sides, appears the most vulnerable to collapse. Needing to likely gain over 140,000 individuals before almost certainly losing population to the current 7th District, the collapsing of the 2nd and 3rd Districts into one seat appears to be a potential outcome. This would place incoming freshman Rep. Barry Moore (R-Enterprise) and veteran Congressman Mike Rogers (R-Anniston) in the same district.


California

For the first time in history, California looks to lose congressional representation. In the last census, the state remained constant for the first time. In every previous census apportionment, the Golden State had gained representation. In the 1980 census, for example, California gained seven new congressional districts. Now, it appears they will reduce representation from 53 to 52 seats, but still be the most populous state by a wide stretch.

The region not keeping up with the rate of growth appears to occur in the southern California expanse from Bakersfield through Los Angeles County and portions of Riverside, Orange, and San Bernardino Counties. Such a region covers 18 congressional districts, 16 of which will need to gain population under a rudimentary calculation suggesting that each of the state’s 52 CDs will require approximately 760,000 residents. Of the 18 districts, Democrats represent 15 and Republicans’ three.

Only two of these 18 districts, those of Reps. Brad Sherman (D-Sherman Oaks) and Norma Torres (D-Pomona), are either at or slightly over the approximated population goal.

Continue reading →