By Jim Ellis
 Oct. 13, 2021 — We’re beginning to see preliminary congressional redistricting plans appear around the country, and it seems both parties are attempting to draw maps to their maximum political advantage where possible.
We’ve seen the Democrats attempt to draw a 5D-1R map in Oregon. It appears on the surface that they may have succeeded, but at the very least, Rep. Kurt Schrader’s (D-Canby/Salem) 5th District looks to be highly competitive in the general election, so such a party division outcome is not yet a given.
Speculation coming from New York, Illinois, and New Mexico, suggest the Democrats will attempt to stretch their advantage in those states, the only ones they fully control for redistricting, to a risky maximum. Sources in New York indicate the Democratic leadership is attempting to craft a map that would convert five of the Republicans’ current eight seats in the state delegation to the Democrats.
In Illinois, the potential plan suggests the Democratic leadership will attempt to take the Republicans down to just three seats in the delegation from their current five. Illinois lost a seat in reapportionment, meaning the Land of Lincoln delegation will return to Washington with 17 instead of 18 members.
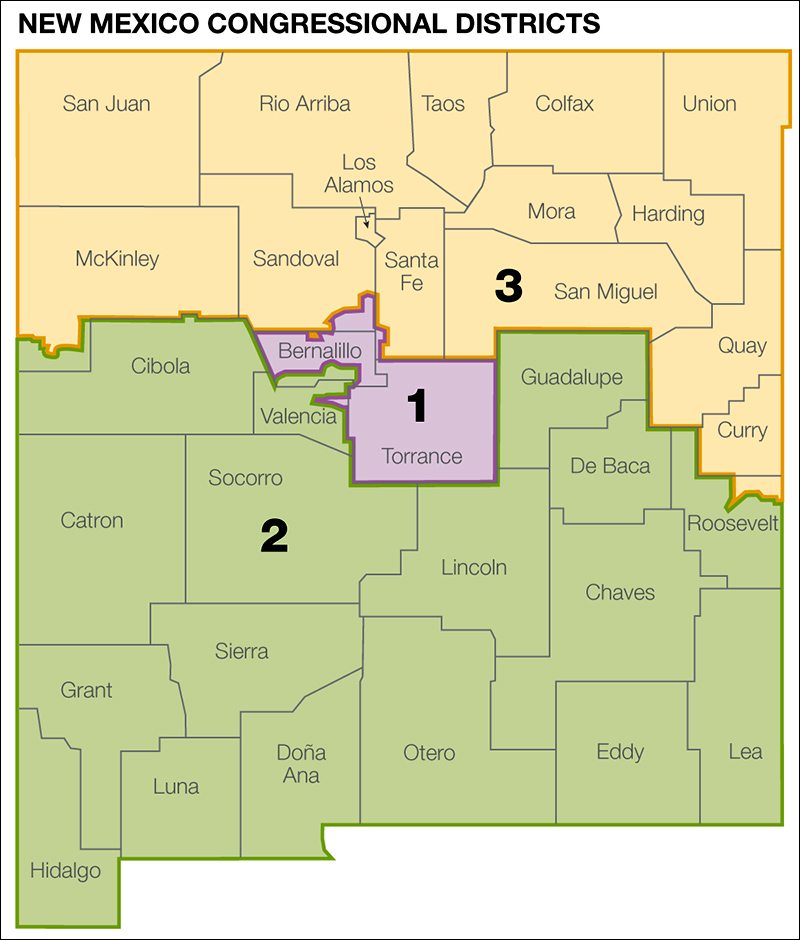
In New Mexico, plans have surfaced to attempt to draw the state’s lone Republican 2nd District into the Democratic column. This requires bringing the 2nd into the Albuquerque metro area for the first time since becoming a three-seat state.
While the aforementioned draws are possible, doing so could create enough politically marginal districts that the plans backfire at least to a degree.
Republicans look to be retaliating in the states that they control outright, meaning places that have not created a redistricting commission or where they don’t already control the maximum number of seats.
The first North Carolina plan was just released, and if passed, the Republicans could net three seats, gaining two when compared to the current plan, while the Democrats lose one. North Carolina is another of the states that is gaining a congressional district from national reapportionment.
The proposed map looks to make major changes and takes advantage of Rep. Ted Budd (R-Advance) leaving the delegation to run statewide for the Senate. This allows the GOP to effectively draw two new seats instead of one. Though the Democrats control the governorship in the person of Roy Cooper, under North Carolina law the state chief executive has no role in redistricting. Therefore, if maps pass both houses of the state legislature, they are enacted. Republicans have significant majorities in both the state House and Senate.


 By Jim Ellis