Tag Archives: Democratic surge

Critical NJ Race in Toss-Up Mode

By Jim Ellis

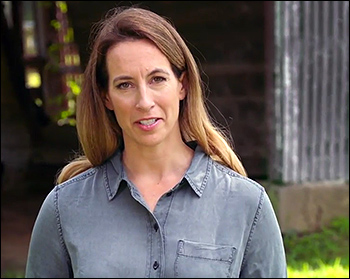
Navy veteran and attorney, Mikie Sherrill

Navy veteran and attorney, Mikie Sherrill (D) | Photo from campaign ad

June 28, 2018 — Democrats have high hopes of converting a northern New Jersey seat that has only elected Republicans during the past 34 years, and a new Monmouth University poll (June 22-25; 406 NJ-11 registered voters) projects a toss-up 11th District contest. The two major party nominees, chosen in early June, are state Assemblyman Jay Webber (R-Morristown) and attorney and Navy veteran Mikie Sherrill (D).

Monmouth polling is experimenting with new sampling methods that involve three different turnout projection models. Their full sample, or “potential” voter model is one that tests only people who have voted in at least one election since 2010 or who are newly registered voters. The second model is what they term a “standard midterm” sample, and the third is in place to monitor a “Democratic surge,” if such were to develop.

The latter phrase has been used frequently in polling and in political commentaries, but there is little evidence of a substantial increase in Democratic primary voting from most states. At this point, national turnout models based solely upon 2018 primary voter turnout suggest a pattern that is closely aligned with a typical midterm performance. So far, more Democrats have been voting in states that normally vote Democratic, and more Republicans are participating in places where GOP candidates dominate.

New Jersey state Assemblyman Jay Webber (R) | Photo from campaign ad

New Jersey state Assemblyman Jay Webber (R) | Photo from campaign ad

According to the full sample model, Democrat Sherrill leads Republican Webber by a scant 40-38 percent. Under the typical midterm model, the Democratic advantage increases to four points, 44-40 percent, but is still within the polling margin of error. Under their potential “Democratic surge” model, which may well prove illusionary when actual votes are counted, Sherrill increases her advantage to 45-39 percent.

The sample is weighted, but the draw does include more Independent voters (plus-three percent) than the raw percentage district total, and is four points less Democratic. But, the weighting formula is supposed to neutralize such discrepancies.

Continue reading

Poll: Manchin Up, But Questions Arise

By Jim Ellis

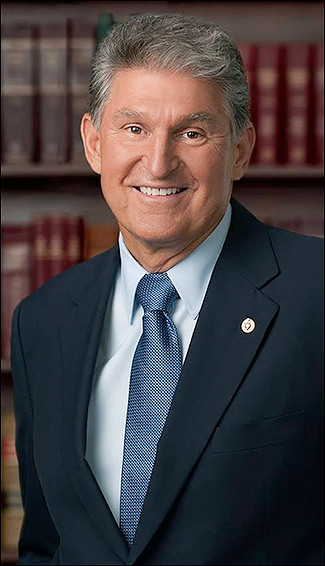
West Virginia Sen. Joe Manchin (D)

West Virginia Sen. Joe Manchin (D)

June 22, 2018 — A new West Virginia statewide survey testing the important US Senate race between Sen. Joe Manchin (D) and Attorney General Patrick Morrisey (R) done by Monmouth University was just released showing Manchin leading Morrisey 50-43 percent, but the polling sample spurs methodological questions.

Monmouth surveyed 653 West Virginia voters between the June 14-19 period, but 428 of them were from the 3rd Congressional District. The sample was heavy in the state’s open southern CD because the pollsters were also testing the US House contest between state Sen. Richard Ojeda (D-Logan) and state House Majority Whip Carol Miller (R-Huntington). The northern 1st District contributed only 87 voters to the sample, while 138 came from the 2nd CD.

To ensure a more representative statewide sample, the Monmouth pollsters weighted the data to compensate for the major discrepancy. But, the weighting still reports that 34 percent of respondents are from the 1st District, 34 percent from the 2nd, and 32 percent from the 3rd, which still gives the latter district the overwhelming preponderance of respondents.

Monmouth reports results under several turnout models. A “potential” voter is one who has participated in at least one election since 2010. A series of responses were also included under a “likely voter” model in what they describe as a “standard midterm election”, while a final response set comes from one that projects a “Democratic surge.”

Continue reading