 By Jim Ellis
Aug. 17, 2021 — We can now see exactly where each congressional district in the country stands in terms of population. The Census Bureau delivered the state redistricting data last week, and the Daily Kos Elections site data team segmented the numbers into individual congressional districts.
Below is a chart of the 38 states that have more than two districts, isolating the CDs that are the most over and under populated. The “High” column depicts the district that is the most over-populated in the state, while the “Low” is the one requiring the most new residents. The “+/-” column shows how many districts in the particular state are over and under populated.
The most robust district is that of Texas freshman Rep. Troy Nehls (R-Richmond). His southwest Houston seat houses just under one million people, at an exact count of 972,309. The least populated seat is West Virginia’s 3rd District (Rep. Carol Miller-R): 326,267 people under quota. With all of the Mountain State seats seriously down, it is clear as to why West Virginia lost a seat in reapportionment.
There are only two states, Colorado and Oregon, where all of the current districts are over-populated. Both entities gain one seat in reapportionment. On the other end of the spectrum, Michigan and Pennsylvania saw all districts falling below their new population quota, and in Illinois, 17 of their current 18 do as well. All three states are losing a district.
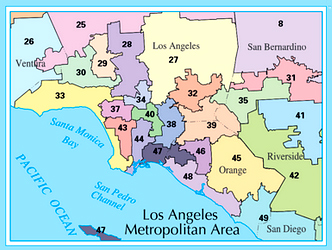
It is not surprising that California lost a seat for the first time in history. A total of 35 of their current 53 seats require more population versus 18 that must shed residents. New York barely lost a seat, by just 89 people statewide, which is surprising when seeing 23 of their current 27 districts requiring additional population.
The states are now converting their new data into their redistricting software systems. After that, most will hold hearings for public input prior to district construction beginning.
| STATE | DIST | INCUMBENT | HIGH | LOW | +/- | |
|---|---|---|---|---|---|---|
| Alabama | 5 | Mo Brooks (R) | 43,348 | 4, 3 | ||
| 7 | Terri Swell (D) | -53,143 | ||||
| Arizona | 5 | Andy Biggs (R) | 86,414 | 3, 6 | ||
| 2 | Ann Kirkpatrick (D) | -50,133 | ||||
| Arkansas | 3 | Steve Womack (R) | 86,266 | 2, 2 | ||
| 4 | Bruce Westerman (R) | -66,283 | ||||
| California | 45 | Katie Porter (D) | 53,645 | 18, 35 | ||
| -1 | 40 | Lucille Roybal-Allard (D) | -70,139 | |||
| Colorado | 4 | Ken Buck (R) | 148,823 | 7, 0 | ||
| +1 | 3 | Lauren Boebert (R) | 36,543 | |||
| Connecticut | 4 | Jim Himes (D) | 25,627 | 2, 3 | ||
| 2 | Joe Courtney (D) | -21,288 | ||||
| Florida | 9 | Darren Soto (D) | 186,381 | 21, 6 | ||
| +1 | 13 | Charlie Crist (D) | -41,756 | |||
| Georgia | 7 | Carolyn Bourdeaux (D) | 94,304 | 8, 6 | ||
| 2 | Sanford Bishop (D) | -92,108 | ||||
| Illinois | 7 | Danny Davis (D) | 10,986 | 1, 17 | ||
| -1 | 17 | Cheri Bustos (D) | -79,907 | |||
| Indiana | 5 | Victoria Spartz (R) | 50,921 | 5, 4 | ||
| 8 | Larry Bucshon (R) | -38,579 | ||||
| Iowa | 3 | Cindy Axne (D) | 61,382 | 1, 3 | ||
| 4 | Randy Feenstra (R) | -31,730 | ||||
| Kansas | 3 | Sharice Davids (D) | 57,816 | 1, 3 | ||
| 1 | Tracey Mann (R) | -33,697 | ||||
| Kentucky | 6 | Andy Barr (R) | 33,300 | 4, 2 | ||
| 5 | Hal Rogers (R) | -57,592 | ||||
| Louisiana | 6 | Garret Graves (R) | 40,173 | 3, 3 | ||
| 4 | Mike Johnson (R) | -47,947 | ||||
| Maryland | 4 | Anthony Brown (D) | 26,772 | 6, 2 | ||
| 7 | Kweisi Mfume (D) | -68,401 | ||||
| Massachusetts | 7 | Ayanna Pressley (D) | 18,714 | 4, 5 | ||
| 1 | Richard Neal (D) | -50,635 | ||||
| Michigan | 11 | Haley Stevens (D) | -17,368 | 0, 14 | ||
| -1 | 5 | Dan Kildee (D) | -104,476 | |||
| Minnesota | 3 | Dean Phillips (D) | 24,586 | 5, 3 | ||
| 7 | Michelle Fischbach (D) | -39,978 | ||||
| Mississippi | 4 | Steven Palazzo (R) | 37,196 | 3, 1 | ||
| 2 | Bennie Thompson (D) | -65,829 | ||||
| Missouri | 3 | Blaine Luetkemeyer (R) | 35,121 | 6, 2 | ||
| 1 | Cori Bush (D) | -54,618 | ||||
| Nebraska | 2 | Don Bacon (R) | 47,170 | 2, 1 | ||
| 3 | Adrian Smith (R) | -53,152 | ||||
| Nevada | 3 | Susie Lee (D) | 79,374 | 2, 2 | ||
| 1 | Dina Titus (D) | -73,332 | ||||
| New Jerseyy | 8 | Albio Sires (D) | 47,314 | 5, 7 | ||
| 2 | Jeff Van Drew (R) | -41,606 | ||||
| New Mexico | 2 | Yvette Harrell (R) | 8,181 | 2, 1 | ||
| 1 | Melanie Stansbury (D) | -11,264 | ||||
| New York | 12 | Carolyn Maloney (D) | 34,717 | 4, 23 | ||
| -1 | 23 | Tom Reed (R) | -83,462 | |||
| North Carolina | 2 | Deborah Ross (D) | 165,703 | 12, 1 | ||
| +1 | 1 | G.K. Butterfield (D) | -6,238 | |||
| Ohio | 3 | Joyce Beatty (D) | 23,119 | 2, 14 | ||
| -1 | 6 | Bill Johnson (R) | -99,512 | |||
| Oklahoma | 1 | Kevin Hern (R) | 36,806 | 3, 2 | ||
| 2 | Markwayne Mullin (R) | -69,793 | ||||
| Oregon | 1 | Suzanne Bonamici (D) | 157,843 | 5, 0 | ||
| +1 | 4 | Peter DeFazio (D) | 117,399 | |||
| Pennsylvania | 10 | Scott Perry (R) | -5,379 | 0, 18 | ||
| -1 | 15 | Glenn Thompson (R) | -90,540 | |||
| South Carolina | 1 | Nancy Mace (R) | 87,689 | 3, 4 | ||
| 6 | Jim Clyburn (D) | -84,741 | ||||
| Tennessee | 4 | Scott DesJarlais (R) | 62,976 | 5, 4 | ||
| 9 | Steve Cohen (D) | -77,122 | ||||
| Texas | 22 | Troy Nehls (R) | 205,322 | 28, 8 | ||
| +2 | 13 | Ronny Jackson (R) | -59,517 | |||
| Utah | 4 | Burgess Owens (R) | 65,265 | 1, 3 | ||
| 3 | John Curtis (R) | -31,190 | ||||
| Virginia | 10 | Jennifer Wexton (D) | 100,750 | 6, 5 | ||
| 9 | Morgan Griffith (R) | -87,917 | ||||
| Washington | 7 | Pramila Jayapal (D) | 28,862 | 6, 4 | ||
| 6 | Derek Kilmer (D) | -33,730 | ||||
| West Virginia | 2 | Alex Mooney (R) | -275,777 | 0, 3 | ||
| -1 | 3 | Carol Miller (R) | -326,627 | |||
| Wisconsin | 2 | Mark Pocan (D) | 52,678 | 2, 6 | ||
| 4 | Gwen Moore (D) | -41,320 |


 By Jim Ellis