Tag Archives: Pennsylvania

The Scenario: There’s an Electoral College Tie in the Presidential
Election; What Happens Next?

By Jim Ellis

Sept. 23, 2020 — As we move closer to Election Day, various scenarios are being discussed and theorized about who will win the presidential race and which states will fall to what candidate. A little-mentioned outcome, which is a mathematical possibility, is an Electoral College tie.

A deadlock would occur if each candidate received 269 electoral votes. Based upon the 2016 result, which saw President Trump receiving 306 electoral votes to Hillary Clinton’s 232, a tie would occur if the incumbent were to lose exactly 37 electoral votes from his previous performance.

The easiest way for that to occur is if President Trump and former vice president Joe Biden were to build the same coalition of states with the exception of Pennsylvania, Michigan and the 2nd District of Nebraska going from the Republican to Democratic column. In this instance, the two 2020 candidates, Trump and Biden, would have 269 electoral votes apiece.

If this were to happen, how is a tie in the Electoral College resolved? The answer: in the House of Representatives. The difference between the vote for president and a regular House vote is that individual members do not have his or her own vote for president. Rather, each state delegation has one vote.

Therefore, California, for example, with its 53 House members gets one vote for president. Conversely, the at-large states with one House member, such as Alaska, Delaware, Montana, North Dakota, South Dakota, Vermont, and Wyoming, would also each get one vote. So the vote for president skews toward the small states and rural regions.

Interestingly though, the Democrats control the House majority with 232 members and one Democratic vacancy to 198 Republican seats with one Libertarian sitting in what is typically a Republican seat and three GOP vacancies. Yet, if partisanship holds, the Republicans would win a presidential election vote 26 to 23 with one state, Pennsylvania, in a 9-9 split delegation. Assuming that the Keystone delegation would fail to agree on a candidate, the state would not be able to cast its vote.

Continue reading

Pennsylvania Voting Rules

By Jim Ellis

Sept. 21, 2020 — Pennsylvania’s Democratic controlled Supreme Court changed their state election procedures late last week in a series of rulings on a lawsuit that the Pennsylvania Secretary of State and PA Democratic Party previously filed.

Under the new process, receiving votes after the election is allowed if “no evidence exists” that the ballot was mailed after Election Day, Nov. 3. The deadline for ballot acceptance now moves from 8 pm on Election Day to 5 pm, Friday, Nov. 6. Pennsylvania becomes the 17th state to allow post-election reception for this 2020 election. The ruling increases the chances that we will not have a winner declared on election night.

Additionally, three other rulings will allow drop boxes to be used as ballot receptacles in the various counties, affirmed that poll watchers can only serve in their own county of residence, and Green Party candidate Howie Hawkins’ name was removed from the ballot. The court did not grant the lawsuit motion to allow ballot harvesting, which would permit third parties to deliver ballots to the authorities or ballot drop boxes.

The drop boxes will be placed in various locations around a county and voters can deposit their ballots without using the postal service to transfer their vote to the county election authorities. Hawkins’ name was removed from the ballot because the court said he “failed to comply with the Election Code’s strict mandate” and the attempts to fix the problem “did not suffice to cure that error,” but the specifics were not addressed.

With the large number of absentee ballots expected here and in other states, the trend toward allowing post-election reception, and the laws that some states, like Pennsylvania, have to control when the mail ballots can be counted, makes it less likely that we will see a definitive presidential campaign result on Nov. 3. The same will be true for certain US Senate and House races.

Of the 17 states, now including Pennsylvania, that are allowing post-election ballot reception, seven appear competitive. The others, Alaska, California, Kansas, Massachusetts, Mississippi, New Jersey, Utah, Virginia, Washington, and West Virginia will likely declare a clear winner relatively early in the counting period.

Continue reading

Why Arizona is So Pivotal

By Jim Ellis

Does Arizona hold the key in a Trump-Biden election?

Sept. 16, 2020 — For several reasons, the Grand Canyon State of Arizona is possibly the most important state on the political map to determine the ultimate presidential election outcome.

Primarily, Arizona is one of five core states that President Trump must win to form a foundation for a favorable remaining state coalition map. The other four, geographically from west to east, are Texas, Georgia, Florida, and North Carolina. Should Joe Biden break through in any one of these five states, he will likely win the national election.

At this point, Arizona appears to be the most precarious of the Trump core states. While the President’s numbers are improving here, the September polls find him trailing Biden in all six publicly released surveys from a range of one to nine points among likely voters, with a mean average of Biden plus-4, and a median of Biden plus-3.5.

The five states are so critical to President Trump, or any Republican national candidate, because, as a unit, they yield a relatively easy remaining victory map. Carrying the five southern sector domains and assuming no leakage in Ohio or Iowa, and even while not winning Nevada or New Hampshire, the GOP nominee then claims the presidency with a victory in any one of the key Great Lakes states: Michigan, Minnesota, Pennsylvania, or Wisconsin. For a Democrat to win under this scenario, he or she would be forced to sweep the aforementioned quartet.

President Trump won the 2016 Electoral College vote 306-232, which means he can relinquish a net 36 electoral votes in 2020 and still win the national election. Under the scenario of him taking either Wisconsin or Minnesota, along with keeping Arizona, he would defeat Biden with exactly 270 electoral votes. This model also assumes he wins the 2nd Congressional District from both Nebraska and Maine, the two states that split their electoral votes. He won both in 2016. Under this scenario, Michigan and Pennsylvania would go to Biden.

Arizona, now potentially teetering toward the Democrats, is critical to the president’s prospects because Trump cannot afford to trade it for one of the western Great Lakes States, either Minnesota or Wisconsin. Such a loss would force the president to win two of the four Great Lakes, but only one could be Minnesota or Wisconsin since those two states have 10 electoral votes and Arizona has 11.

Therefore, simply put, losing Arizona because of its 11th electoral vote would mean that Trump would be forced to carry either Michigan or Pennsylvania in addition to one of the other three remaining Great Lakes States. A further scenario involving Trump losing Arizona and replacing it with both of the 10-electoral vote states (MN and WI) could result in the election ending in a 269-269 tie. This would force a tiebreaker to be decided in the US House of Representatives.

Let’s look at the chances of Trump winning Arizona by comparing his current standing to where he was at this point in 2016. Looking at the Real Clear Politics polling archives, we find that 19 Arizona polls were conducted during the entire 2016 election cycle. In 2020, just since the July 4th holiday break, 25 surveys were publicly reported in the Grand Canyon State.

Four years ago, at the end of August through mid-September, two individual polls came from Gravis Marketing (Aug. 25-27, 2016) and NBC News/Marist College (Sept. 6-8, 2016). These surveys yielded Trump four and one-point leads, respectively. Shortly thereafter, the trend began to turn Hillary Clinton’s way. The OH Predictive Insights survey (Sept. 28-30, 2016) found the two candidates tied at 42 percent apiece, while Emerson College (Oct. 2-4, 2016) and the Arizona Republic newspaper poll (Oct. 10-15, 2016) detected consecutive leads for Clinton of two and five points.

Therefore, Arizona did not turn toward Trump for good until the Monmouth University survey in late October (Oct. 21-24, 2016), which put him just one point ahead. Going into the election from that point, and remembering the 2016 election was on Nov. 8, Trump led in the final four polls from a two to five-point margin. He would eventually win the actual vote count by 3.6 percentage points, 48.7 – 45.1 percent, meaning a raw vote margin of 91,234 votes of more than 2.573 million ballots cast.

Because of Arizona’s fast population growth, the state has changed in four years. During that interval, the overall population expanded five percentage points to 7,278,717 individuals according to the Census Bureau’s July 2019 estimate, the latest available.

Minorities, specifically Hispanics and blacks, account for approximately 69 percent of the population gain, thus at least partially explaining Biden’s improved prospects in the state. Overall, Hispanics represent 31.7 percent of the overall Arizona population, and blacks 5.2 percent, as compared to the non-Hispanic white position receding to 54.1 percent.

The population changes suggest that this already tight political state will likely become even closer as we head for Nov. 3.

A Polling Comparison

By Jim Ellis

Neck-and-neck polling in a few key battleground states between President Donald Trump and former vice president Joe Biden shows interesting parallels to the 2016 race between Trump and Hillary Clinton.

Sept. 10, 2020 — With a plethora of presidential polls being released every week providing sometimes radically diverse results, it is often difficult to draw a clear picture of where the electorate is heading.

The conventional wisdom and preponderance of polling trends suggest that Joe Biden is leading the presidential race, but that President Trump is making a comeback, and the race is beginning to show some of the same characteristics found in 2016.

Three of the key states that baffled the political pollsters four years ago were Michigan, Pennsylvania, and Wisconsin. As we will remember, President Trump was expected to lose them all but scored close upset victories in each place.

The aggregate group of 2016 pollsters missed in each of the three states and the Real Clear Politics polling archives still publicly maintains all of those survey results. Therefore, we have the historical data to draw clear parallels between then and now.

In Wisconsin, 33 polls were taken during the election cycle and only one, from the Trafalgar Group at the end of the campaign season, placed Trump in front. A total of 62 polls were conducted in Pennsylvania with only three, again including a Trafalgar poll, projecting the future president into the lead. In Michigan, 42 polls were publicly released with Trump ahead in just two.

Though it is not generally statistically significant to average polling results because the polling methodologies, and certainly sample sizes, are very different, doing so does give us a guide as to the error factor that was present in 2016, and possibly a glimpse into what might exist this year.

In Wisconsin, the average Hillary Clinton lead advancing into the general election was 6.5 percentage points. With a 0.7 percent win for Trump, the overall error factor became a whopping 7.2 percent. The Pennsylvania numbers were closer but still a significant miss. Clinton’s average lead heading into Election Day was 2.1 percent and the president won there by the same 0.7 percent that he carried Wisconsin. Therefore, the Keystone State error factor was 2.8. Michigan was a similar story. Error factor: Clinton plus-3.6 percent. Trump victory margin: just 0.3. Total Michigan error factor: 3.9.

Continue reading

Presidential Polling Progress

By Jim Ellis

Aug. 27, 2020 — The Republican National Convention coverage featured several mentions of swing state polling getting closer between the two presidential candidates, and recent moves from both sides would seem to suggest that internal survey numbers also reflect such a trend.

Below, we compare the 10 most recent polls with the 10 prior surveys in each of the key states to better illustrate the campaign’s movement:


ARIZONA

Last 10 Public Polls: July 17 – August 23
• Biden Aggregate Average Lead: 3.2%

Previous 10 Public Polls: June 26 – July 24
• Biden Aggregate Average Lead: 4.4%

Swing: Trump +1.2%


FLORIDA

Last 10 Public Polls: July 17 – August 22
• Biden Aggregate Average Lead: 3.2%

Previous 10 Public Polls: June 8 – July 21
• Biden Aggregate Average Lead: 6.9%

Swing: Trump +3.7%


GEORGIA

Last 10 Public Polls: July 9 – August 15
• Trump Aggregate Average Lead: 0.4%

Previous 10 Public Polls: May 4 – July 2
• Trump Aggregate Average Lead: 0.1%

Swing: Trump +0.3%


MICHIGAN

Last 10 Public Polls: July 24 – August 23
• Biden Aggregate Average Lead: 7.0%

Previous 10 Public Polls: July 9 – July 26
• Biden Aggregate Average Lead: 7.4%

Swing: Trump +0.4%


Continue reading

Plethora of House Polls Released; All Tell Unique Stories

By Jim Ellis

Aug. 14, 2020 — In the past several days, 14 polls in 13 competitive House districts were publicly released, and they all tell a unique story. The synopsis is below (in alphabetical order):


CO-3:
• GQR Research – Mitsch Bush (D) 43%; Boebert (R) 42%

Greenberg Quinlan Rosner Research (Aug. 3-6; 400 likely CO-3 voters) went into the field to test Democratic candidate Diane Mitsch Bush versus Republican Lauren Boebert, who unseated Rep. Scott Tipton (R-Cortez) in the June Republican primary.

The result here is not particularly surprising considering that Boebert was a shocking upset winner in the GOP primary. Mitsch Bush has a huge cash advantage, but Republicans will likely rally around Boebert in a district where President Trump should comfortably win.


IL-13:
• RMG Research – Londrigan (D) 43%; Rep. Davis (R) 41%

After seeing the 2018 election between Rep. Rodney Davis (R-Taylorville) and challenger Betsy Dirksen Londrigan (D) evolve into a 50.3 – 49.6 percent result, the pair returns for Round 2. The RMG poll (July 27-Aug. 7; 400 likely IL-13 voters), though over a very long sampling period, finds what has been clear for some time, that the 2020 edition will yield another tight race.


IN-5:
• WPA Intelligence – Spartz (R) 47%; Hale (D) 40%

The new WPA Intelligence poll (Aug. 4-6; 400 likely IN-5 voters) produces the opposite result of a survey we saw from the GBAO research organization in late June (June 25-28; 500 likely IN-5 voters). The latter study projected Democratic former state representative and ex-lieutenant governor nominee Christina Hale topping Republican state Sen. Victoria Spartz, 51-45 percent.

According to the current WPA data, Sen. Spartz, a Ukrainian immigrant, now holds a 47-40 percent advantage. The latter numbers are more consistent with the district’s voting history. Incumbent Rep. Susan Brooks (R-Carmel) is retiring.


Continue reading

The Polling Extremes

By Jim Ellis

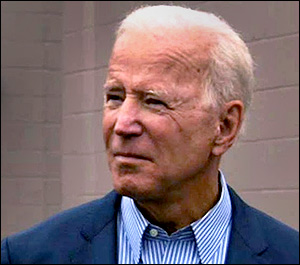
Former vice president and 2020 presidential candidate, Joe Biden (D)

July 31, 2020 — Two survey research organizations, Morning Consult and Change Research, just released the results of their recent battleground states polling series. Looking at all the recent public data in these places illustrates the polling volatility and movement within the states that will ultimately decide the presidential election.

The ballot test results listed for each state below illustrates the most extreme examples for President Trump and former vice president Joe Biden during the mid to late July period. With such a wide variance in most places, it is difficult to say with any certainty exactly how these defining states will actually perform come Election Day.

President Donald Trump

It is also important to take into account sample size, sample segmentation, and whether the poll was conducted through live interview, online questioning, or an interactive voice response system.


ARIZONA
• Morning Consult (JULY 17-26, 908 likely Arizona voters)
Joe Biden (D) ………….. 49% (+7)
Donald Trump (R) ……. 42%
• Change Research (July 24-26, 365 likely Arizona voters; targeted online sample)
Joe Biden (D) ………….. 47% (+2)
Donald Trump (R) ……. 45%

Arizona surveys have consistently yielded small leads for Biden over the past several months. Most of the recent results find the candidates falling within the polling margin of error.


FLORIDA
• Morning Consult (July 17-26, 3,593 likely Florida voters; online)
Donald Trump (R) ……. 48% (+1)
Joe Biden (D) ………….. 47%
• Quinnipiac University (July 16-20, 924 registered Florida voters; live interview)
Joe Biden (D) ………….. 51% (+13)
Donald Trump (R) ……. 38%

This is the most divergent spread within all of the battleground states. Florida’s polling history has routinely featured wide polling ranges that result in close election results.
Continue reading