By Jim Ellis
March 2, 2020 — Former vice president Joe Biden accomplished his goal of reviving his downward trending presidential campaign on Saturday. He won the South Carolina primary with 48.4 percent of the vote, topping Sen. Bernie Sanders’ (I-VT) 19.9 percent. Billionaire Tom Steyer, who spent millions attempting to make a stand in South Carolina and access the delegate board finished third with 11.3 percent. Failing to win bound delegates, Steyer officially exited the race after the results became known.
Former South Bend mayor Pete Buttigieg, a top-tier candidate, citing no viable path to the nomination, also dropped his campaign bid. This move is a bit of a surprise in that he was in position to win some delegates tomorrow in the Super Tuesday primaries; though leading in no states, he might have been able to affect the outcome of a contested convention should such an eventuality actually occur.
On the delegate count, Biden notched 38 bound first-ballot delegate votes, and Sen. Sanders’ added 16 to his national total. Going into Super Tuesday, Sen. Sanders still has a national lead, but it has dropped to 60-54 over Biden. Buttigieg, who scored 8.3 percent in South Carolina and finished fourth, remains at 26 bound delegate votes. Sen. Elizabeth Warren (D-MA) continues to hold eight votes and Minnesota Sen. Amy Klobuchar has seven. Sen. Warren finished fifth in the Palmetto State primary, with 7.1 percent, and Sen. Klobuchar recorded only 3.1 percent support.
Turnout increased substantially in comparison to the 2016 Democratic primary. More than 528,000 individuals look to have voted in Saturday’s primary, up from 370,904 in 2016. It is noteworthy to remember, however, that there was no Republican primary this year, meaning some self-identified Republican voters may have participated in the open voting system. The turnout was slightly below that of 2008, when 532,151 individuals cast ballots in that year’s Democratic primary even though Republicans and new voters, which should be a substantial since the state has rapidly grown during the past twelve years, are present in the current vote.
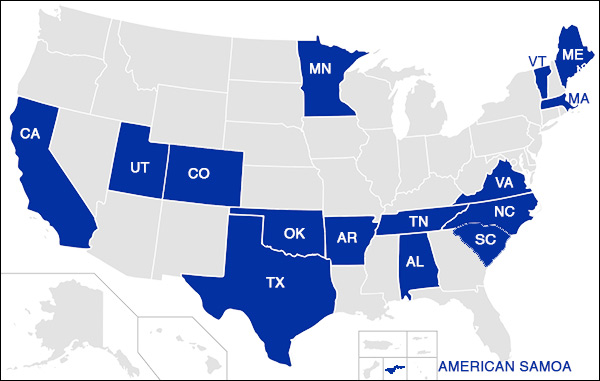
Now the stage is set for Super Tuesday, with Sanders and Biden in a virtual tie, and former New York City mayor Michael Bloomberg on a primary ballot for the first time. With Sanders and Biden now so close, it appears unlikely that the Super Tuesday result won’t give either one a commanding advantage.