Tag Archives: Hillary Clinton

The Scenario: There’s an Electoral College Tie in the Presidential
Election; What Happens Next?

By Jim Ellis

Sept. 23, 2020 — As we move closer to Election Day, various scenarios are being discussed and theorized about who will win the presidential race and which states will fall to what candidate. A little-mentioned outcome, which is a mathematical possibility, is an Electoral College tie.

A deadlock would occur if each candidate received 269 electoral votes. Based upon the 2016 result, which saw President Trump receiving 306 electoral votes to Hillary Clinton’s 232, a tie would occur if the incumbent were to lose exactly 37 electoral votes from his previous performance.

The easiest way for that to occur is if President Trump and former vice president Joe Biden were to build the same coalition of states with the exception of Pennsylvania, Michigan and the 2nd District of Nebraska going from the Republican to Democratic column. In this instance, the two 2020 candidates, Trump and Biden, would have 269 electoral votes apiece.

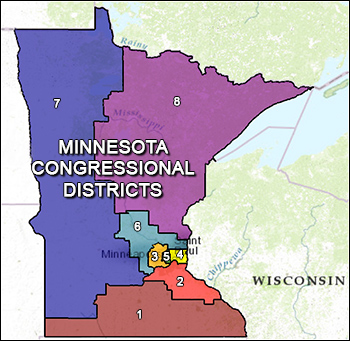
If this were to happen, how is a tie in the Electoral College resolved? The answer: in the House of Representatives. The difference between the vote for president and a regular House vote is that individual members do not have his or her own vote for president. Rather, each state delegation has one vote.

Therefore, California, for example, with its 53 House members gets one vote for president. Conversely, the at-large states with one House member, such as Alaska, Delaware, Montana, North Dakota, South Dakota, Vermont, and Wyoming, would also each get one vote. So the vote for president skews toward the small states and rural regions.

Interestingly though, the Democrats control the House majority with 232 members and one Democratic vacancy to 198 Republican seats with one Libertarian sitting in what is typically a Republican seat and three GOP vacancies. Yet, if partisanship holds, the Republicans would win a presidential election vote 26 to 23 with one state, Pennsylvania, in a 9-9 split delegation. Assuming that the Keystone delegation would fail to agree on a candidate, the state would not be able to cast its vote.

Continue reading

Reading North Carolina

By Jim Ellis

Sept. 17, 2020 — CNN released new North Carolina poll results earlier this week, and we again see a familiar pattern unfolding. There has been a Republican under-poll in the southern states detected in the past few elections, and the North Carolina pattern appears to form relatively consistently upon studying its most competitive statewide races in 2014, ’16, and what may be happening in 2020. There were no statewide Tar Heel State contests in 2018.

The CNN poll (conducted through the SSRS statistical firm; Sept. 9-13; 787 likely North Carolina voters; live interview through landline and mobile phones) found former vice president Joe Biden leading President Trump, 49-46 percent; Democratic US Senate nominee Cal Cunningham edging incumbent Republican Thom Tillis, 47-46 percent; and Gov. Roy Cooper (D) easily outdistancing Republican Lt. Gov. Dan Forest, 53-44 percent.

How do these mid-September races compare with other campaigns at this same interval, and what does that tell us for autumn?

First, the CNN poll is one of seven polls conducted in North Carolina during the month of September, and its three-point margin for Biden is the Democrat’s second-best showing within this group. The only better Biden performance came from the Fox News poll at the beginning of September (Aug. 29-Sept. 1; 722 likely North Carolina voters, live interview), which posted him to a four-point, 50-46 percent, advantage.

Among the five other surveys, Biden is ahead in two, President Trump in two, and one has the pair tied at 47 percent apiece (Survey USA for WRAL-TV; Sept. 10-13; 596 likely North Carolina voters). From the eight polls conducted from Aug. 29-Sept. 13, Biden’s edge is just 0.7 percent, meaning the two candidates average to a statistical tie.

Recent political history suggests that this type of an average spread sets up well for President Trump, and possibly Sen. Tillis. It appears that Gov. Cooper’s margin is beyond the statistically relevant late-term Republican swing.

In September of 2016, a total of 14 publicly released polls were conducted during that month. Within this group, Hillary Clinton led in 10 of the surveys with an average spread of 2.4 percentage points. Trump was ahead in just three polls with an average margin of 2.0 percent. Two polls found the candidates tied. Therefore, Clinton’s overall September edge was an average 1.1 percent.

Continue reading

A Polling Comparison

By Jim Ellis

Neck-and-neck polling in a few key battleground states between President Donald Trump and former vice president Joe Biden shows interesting parallels to the 2016 race between Trump and Hillary Clinton.

Sept. 10, 2020 — With a plethora of presidential polls being released every week providing sometimes radically diverse results, it is often difficult to draw a clear picture of where the electorate is heading.

The conventional wisdom and preponderance of polling trends suggest that Joe Biden is leading the presidential race, but that President Trump is making a comeback, and the race is beginning to show some of the same characteristics found in 2016.

Three of the key states that baffled the political pollsters four years ago were Michigan, Pennsylvania, and Wisconsin. As we will remember, President Trump was expected to lose them all but scored close upset victories in each place.

The aggregate group of 2016 pollsters missed in each of the three states and the Real Clear Politics polling archives still publicly maintains all of those survey results. Therefore, we have the historical data to draw clear parallels between then and now.

In Wisconsin, 33 polls were taken during the election cycle and only one, from the Trafalgar Group at the end of the campaign season, placed Trump in front. A total of 62 polls were conducted in Pennsylvania with only three, again including a Trafalgar poll, projecting the future president into the lead. In Michigan, 42 polls were publicly released with Trump ahead in just two.

Though it is not generally statistically significant to average polling results because the polling methodologies, and certainly sample sizes, are very different, doing so does give us a guide as to the error factor that was present in 2016, and possibly a glimpse into what might exist this year.

In Wisconsin, the average Hillary Clinton lead advancing into the general election was 6.5 percentage points. With a 0.7 percent win for Trump, the overall error factor became a whopping 7.2 percent. The Pennsylvania numbers were closer but still a significant miss. Clinton’s average lead heading into Election Day was 2.1 percent and the president won there by the same 0.7 percent that he carried Wisconsin. Therefore, the Keystone State error factor was 2.8. Michigan was a similar story. Error factor: Clinton plus-3.6 percent. Trump victory margin: just 0.3. Total Michigan error factor: 3.9.

Continue reading

The Presidential Debates Loom

By Jim Ellis

Sept. 1, 2020 — The Presidential Debate series looms on the political horizon, and controversy is beginning to swirl even though the first forum is still a month away.

The first in a series of currently three presidential debates is set for Sept. 29.

House Speaker Nancy Pelosi said last week that Democratic nominee Joe Biden shouldn’t debate President Trump. “I wouldn’t legitimize a conversation with him, nor a debate in terms of the presidency of the United States,” she was quoted as saying at a news conference.

At the end of July, former Bill Clinton news secretary Joe Lockhart wrote for CNN.com that Biden shouldn’t debate the president. “Whatever you do, don’t debate Trump. Trump has now made more than 20,000 misleading or false statements according to the Washington Post,” Lockhart penned as public advice to Biden.

Some on the Republican side argue that these Democratic leaders are beginning to lay the groundwork for Biden to avoid the debates because of concerns their candidate would fare poorly opposite President Trump.

For his part, Biden says he will debate the president, and become his own “fact checker on the floor.” He will also begin holding campaign events after Labor Day. In an Aug. 28 interview with the Associated Press, Biden said he’ll “meet people where it matters – not at irresponsible rallies or staged for TV to boost egos, but real people’s communities, in real local businesses, in their lives.” Biden further said he’ll “hold events consistent with the state rules about crowd sizes and other regulations.”

The first debate is scheduled for Tuesday, Sept. 29, the second on Thursday, Oct. 15, and the final forum culminates a week later on Oct. 22. The vice presidential debate between incumbent Vice President Mike Pence and Sen. Kamala Harris (D-CA) is scheduled for Wednesday, Oct. 7.

The debates have proven important in the past and always draw large audiences. According to the Pew Research Center, even the first televised debate, between then-Sen. John F. Kennedy and then-Vice President Richard Nixon, drew over 66 million viewers usually on black and white televisions, at a time when the US population was just under 181 million people, or approximately 55 percent of today’s total populace.

Continue reading

Minnesota: A Player

By Jim Ellis

May 27, 2020 — Most of this year’s political attention will be focused on the presidential election’s top tier states of Arizona, Florida, Georgia, Michigan, North Carolina, Pennsylvania, Texas, and Wisconsin, but a second-tier domain could also become a political player, at least according to a new poll.

Mason-Dixon Polling & Strategy, surveying for the Star Tribune newspaper, along with Minnesota Public Radio and KARE Television Channel 11 (May 18-20; 800 registered Minnesota voters) finds former vice president Joe Biden, as expected, leading President Trump. The margin between the two contenders, however, is a relatively close 49-44 percent.

Minnesota has been the most loyal domain for Democratic presidential nominees. The last time the state’s electorate voted Republican for the nation’s top office occurred all the way back in 1972 when President Richard Nixon carried the North Star State over then-Sen. George McGovern (D-SD). In 1984, President Ronald Reagan came close to beating former vice president and ex-Minnesota senator Walter Mondale but fell 3,761 votes short. The next closest Republican finisher was President Trump in 2016, losing in a 1.5 percentage point spread.

The Trump campaign has already said publicly they plan to make Minnesota a target, along with New Hampshire – another Hillary Clinton state that was close (46.8 – 46.5 percent) – a result that would give Trump a huge boost if he were to convert any state that went against him four years ago.

The Mason-Dixon Minnesota poll divides in stark fashion. The Minneapolis-St. Paul area, specifically noted as Hennepin and Ramsey counties in this survey, breaks for Biden, 62-29 percent. The rest of the metro area, defined as the Twin Cities’ outer suburbs, posts a much closer 48-44 percent Biden edge.

Continue reading

The Maine Event

By Jim Ellis

Maine Congressional Districts

May 20, 2020 — The small state of Maine, with its two congressional districts, is going to attract a great deal of political attention between now and the election. Not only is the Pine Tree State one of the firewalls for Republican Senate majority hopes, the domain, one of two places that splits its electoral votes, will likely play a major role in determining the presidential election outcome, as well.

Maine and Nebraska divide their electoral votes such that the winning statewide candidate earns two electoral votes, while the victor in each congressional district is awarded one EV for as many districts as they carry. Maine, as mentioned, has two districts, and Nebraska three.

These districts came into play both in 2008 and 2016, when Barack Obama carried the 2nd District of Nebraska against John McCain in the former year, and Donald Trump took the 2nd District of Maine opposite Hillary Clinton in 2016. While neither CD became a factor in determining each of those elections, these CDs breaking differently than their state in a tight national election could result in the Electoral College ending in a tie.

The 48 other states and the District of Columbia use the winner-take-all system. Any state could divide their electoral votes like Maine and Nebraska, but those are the only two who choose the split vote method.

In the current presidential election scenarios, whether or not President Trump again carries ME-2 could determine if he is re-elected. Under one scenario, former vice president Joe Biden could win the national race even if he failed to carry Wisconsin so long as he takes the 2nd District of Maine and 2nd District of Nebraska. Doing so, along with winning the other swing states that touch a Great Lake, meaning Michigan and Pennsylvania, he would secure exactly 270 electoral votes, the bare minimum to claim national victory.

Continue reading

Nevada: A Target?

By Jim Ellis

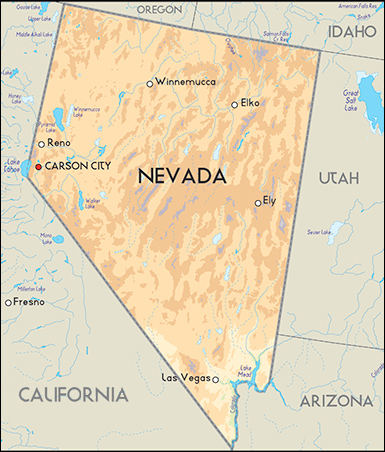
May 8, 2020 — The Silver State of Nevada, with six Electoral College votes, has been regarded as a swing state in most 21st Century presidential elections, but in projecting the 2020 vote, it is routinely considered as a place destined to land in the Democratic column. But, could Nevada ultimately be in play for President Trump?

With a general election electoral vote map looking ever closer as we move toward November, introducing a new target could drastically change the eventual outcome or at least the campaign focus and strategy.

A new ALG Research poll (April 27-30; 76 likely Nevada general election voters) reports findings that are consistent with virtually all of the 2016 Nevada general election surveys. Last week, the firm found former vice president Joe Biden leading President Trump with a 49-45 percent spread. Such a margin and preference percentages fall into the same realm as all 31 polls conducted in Nevada from May through the November 2016 election.

When ‘16 ended, Hillary Clinton carried the state, but her margin was only 2.4 percentage points, meaning a 27,000-vote spread of more than 1.12 million ballots cast. And, consistent with the large number of polls that concluded a close race within the 40s would be the actual result, Clinton defeated Trump, 47.9 – 45.4 percent, validating the plethora of research conducted over the final five-plus months of that election cycle.

Four years ago, 13 different pollsters conducted the almost three dozen surveys, and in no instance did either Trump or Clinton ever reach the 50 percent plateau. On the other end of the spectrum, in just three instances did one of the candidates dip below 40 percent. Therefore, in 28 of the 31 studies logged within the 2016 Real Clear Politics polling archives, both candidates fell within the 40s, meaning this result occurred over 90 percent of the time. In terms of range, the span stretched from Clinton plus-7 to Trump plus-6, but the average between the two was only 2.7 percent, which is almost exactly the actual final total. This obviously suggests a competitive political battlefield.

Continue reading